
| Professional Committee of Rock and Mineral Testing Technology of the Geological Society of China, National Geological Experiment and Testing Center | Host |

| Citation: |
KONG Weiheng, ZENG Lingwei, RAO Yu, CHEN Sha, WANG Xu, YANG Yanting, DUAN Yixiang, FAN Qingwen. Laser-induced Breakdown Spectroscopy Based on Pre-classification Strategy for Quantitative Analysis of Rock Samples[J]. Rock and Mineral Analysis, 2023, 42(4): 760-770. doi: 10.15898/j.ykcs.202212190234

|
Laser-induced Breakdown Spectroscopy Based on Pre-classification Strategy for Quantitative Analysis of Rock Samples
-
Abstract
BACKGROUND LIBS technology is a non-destructive, high sensitivity, high resolution spectroscopy technology that can be used to analyze the composition and structure of chemical substances and materials. It has extensive application in fields such as chemistry, materials science, life science, and geological exploration, and its emergence has provided new methods and technologies for the development of these fields. LIBS technology can be used to non-destructively analyze the chemical composition of underground rocks and minerals, helping geologists to better understand the composition and properties of underground resources, thus providing better guidance for geological exploration and development. In recent years, scholars at home and abroad have been exploring LIBS technology constantly, and through improving the detection system and optimizing laser pulse parameters, high sensitivity LIBS analysis at extremely low concentration has been achieved. By using finer spectral lines, higher sampling rate, and more precise laser pulse control, high resolution LIBS analysis at nanoscale has been achieved. The combination of LIBS technology with multi-spectral image processing technology can integrate information from multiple spectral channels to achieve a more comprehensive analysis of samples. However, the existence of matrix effects and spectral fluctuations always affects the accuracy of LIBS quantitative analysis, and poor reproducibility and high detection limits also need to be solved.
OBJECTIVES To improve the accuracy of quantitative analysis of complex matrix samples.
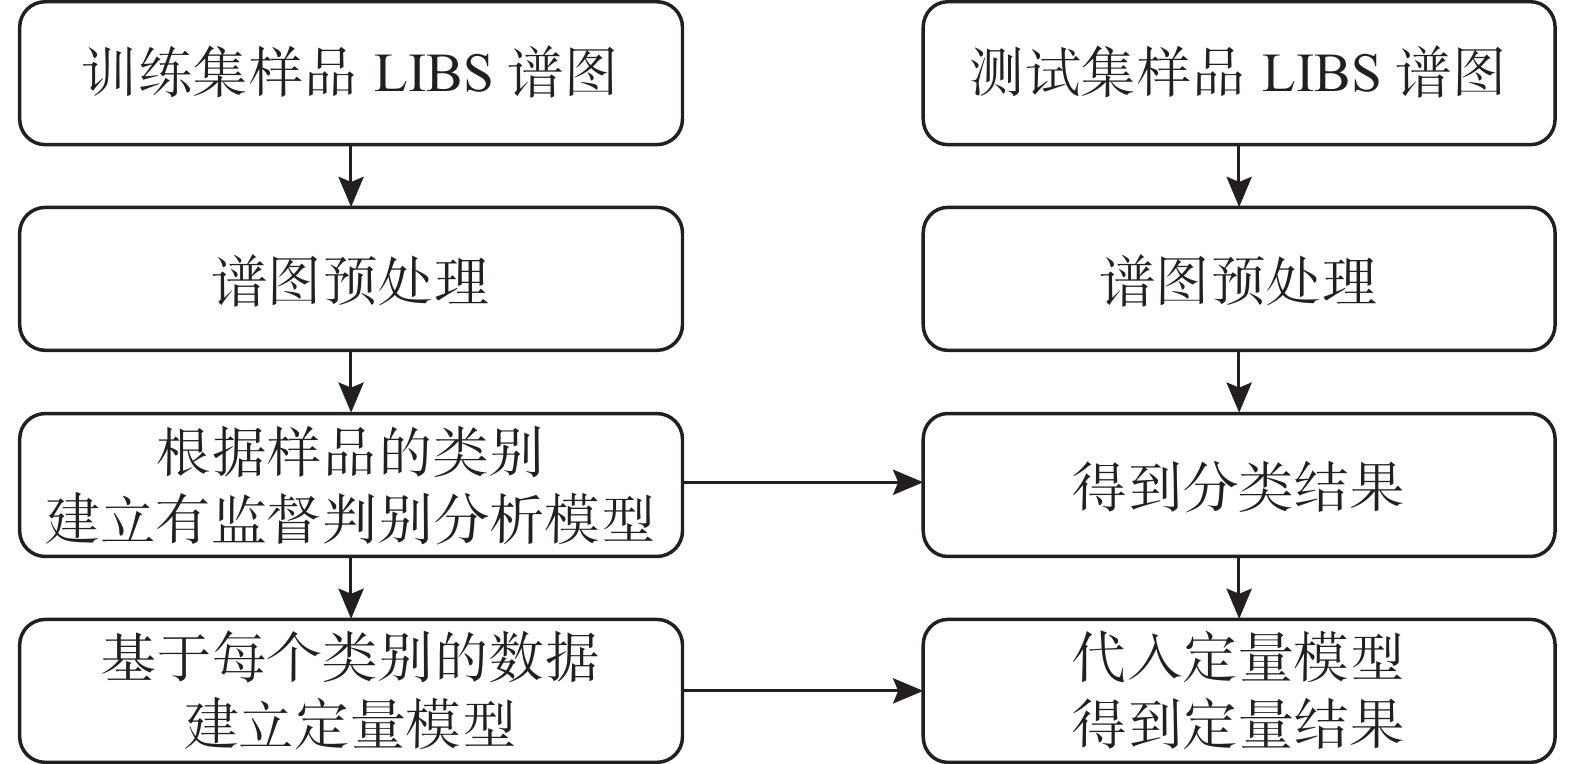
METHODS A multi-layer classification model based on k-nearest neighbors (kNN) and support vector machine (SVM) algorithms was constructed to identify the rock type of samples. The samples were divided into two major categories of felsic rocks and mafic rocks using the kNN algorithm, and then six categories were formed by the SVM algorithm. Different element quantitative models were constructed for each rock type. The kNN algorithm was selected using cross-validation to determine the optimal k value, and the key punishment parameter C and RBF width parameter γ of the SVM algorithm were determined using a grid search method. Then, appropriate pre-processing methods were adopted to improve the stability of spectral data for different elements in different rock types. Compared to the traditional standard curve quantitative method, using the pre-classification method can reduce the influence of different rock matrices on each other, thus reducing errors caused by the non-uniform matrix of samples.
RESULTS Due to the influence of matrix effects, a single pre-processing method is not suitable for all elements in quantitative analysis. Therefore, in order to improve the accuracy and stability of quantitative analysis, different methods are used to pre-process the data. For different pre-processing methods, the R2 values of four elements in six types of rock samples are mostly greater than 0.90, as shown in Table 2. After pre-processing, the correlation coefficients of the four elements are significantly improved, and they are all higher than 0.99. The correlation coefficients of Si, Ca, Mg, and K elements in the test set after quantitative analysis are increased from 0.664, 0.638, 0.461, and 0.231 to 0.999, 0.994, 0.999, and 0.996, respectively. In addition, it can be seen from the analysis of the data that the traditional quantitative analysis model has poor stability. The average relative standard deviation (RSD) of Si, Ca, Mg, and K elements in the test set are 3.4%, 10.7%, 48.2%, and 90.8%, respectively, while the RSD of four elements in the multi-layer model are 1.5%, 5.2%, 10.3%, and 17.4%, which shows a significant improvement in stability compared to traditional quantitative analysis models. At the same time, it can be more intuitively evaluated by comparing the average relative error between the predicted value and the target value of each element in the test set. As shown in Table 3, the prediction performance of Si element in the multi-layer model is the best, with an average relative error of only 4.65%. Although the average relative error of the other three elements is over 10%, it is significantly improved compared to the traditional standard curve model.
CONCLUSIONS By utilizing a multi-layer classification model for preliminary categorization, standard rock samples that match the matrix are obtained. Subsequently, quantitative analysis models are developed for samples with similar matrices. Employing distinct preprocessing methods for different elemental compositions within various rock types helps mitigate spectral discrepancies caused by matrix effects, reduces spectral fluctuations and data noise, and enhances the accuracy and stability of quantitative analysis. Standard curve models are then established for each element, enabling quantitative analysis of Si, Ca, Mg, and K elements in six categories of rock samples. Results demonstrate a notable improvement in the accuracy of quantitative analysis compared to traditional standard curve models. This model not only diminishes the impact of matrix effects on quantitative analysis but also corrects instabilities arising from hardware, environmental conditions, and sample variations. Furthermore, it alleviates the workload of data analysis, simplifying the analytical process and thereby boosting efficiency. However, the current multi-layer quantitative analysis model still exhibits some deviations in regard to different elements. In the future, a potential avenue is to consider integrating various algorithms to establish preliminary classification models, aiming for even better quantitative analysis outcomes.
-

-
References
[1] Guo L B,Zhang D,Sun L X,et al. Development in the application of laser-induced breakdown spectroscopy in recent years:A review[J]. Frontiers of Physics, 2021, 16(2): 1−25. [2] Harmon R S, Senesi G Sl. Laser-induced breakdown spectroscopy—A geochemical tool for the 21st century[J]. Applied Geochemistry, 2021, 128: 104929. [3] 杨春梅,黄梓芸,覃静雯,等. 应用钻石观测仪-红外光谱仪-激光诱导击穿光谱仪鉴定无机材料充填翡翠[J]. 岩矿测试, 2022, 41(2): 281−290. doi: 10.15898/j.cnki.11-2131/td.202109170123 Yang C M,Huang Z Y,Qin J W,et al. Identification of jadeite filled with inorganic materials using UV fluorescence,infrared spectroscopy and LIBS techniques[J]. Rock and Mineral Analysis, 2022, 41(2): 281−290. doi: 10.15898/j.cnki.11-2131/td.202109170123 [4] Zhao S X,Zhang L,Hou J J,et al. Accurate quantitative CF-LIBS analysis of both major and minor elements in alloys via iterative correction of plasma temperature and spectral intensity[J]. Plasma Science & Technology, 2018, 20(3): 035502. [5] Che C,Lin X,Gao X,et al. Accuracy improvement for multimetal analysis by laser-induced breakdown spectroscopy with least squares support vector machine[J]. Microwave and Optical Technology Letters, 2021, 63(6): 1635−1641. doi: 10.1002/mop.32811 [6] Ie A,Kra B,Jia C,et al. Measuring the concentration of gold in ore samples by laser-induced breakdown spectroscopy (LIBS) and comparison with the gravimetry/atomic absorption techniques[J]. Spectrochimica Acta Part B:Atomic Spectroscopy, 2021, 183: 106256. doi: 10.1016/j.sab.2021.106256 [7] Devangad P,Unnikrishnan V K,Nayak R,et al. Performance evaluation of laser induced breakdown spectroscopy (LIBS) for quantitative analysis of rare earth elements in phosphate glasses[J]. Optical Materials, 2016, 52: 32−37. doi: 10.1016/j.optmat.2015.12.001 [8] Alvarez-Llamas C,Purohit P,Moros J,et al. LIBS-acoustic mid-level fusion scheme for mineral differentiation under terrestrial and martian atmospheric conditions[J]. Analytical Chemistry, 2022, 94(3): 1840−1849. doi: 10.1021/acs.analchem.1c04792 [9] Khan M N,Wang Q Q,Idrees B S,et al. A review on laser-induced breakdown spectroscopy in different cancers diagnosis and classification[J]. Frontiers in Physics, 2022, 10: 821057. doi: 10.3389/fphy.2022.821057 [10] Wan X,Wang P. Analysis of heavy metals in organisms based on an optimized quantitative LIBS[J]. Optik, 2015, 126(19): 1930−1934. doi: 10.1016/j.ijleo.2015.05.039 [11] Wang Q Q,Xiangli W T,Teng G,et al. A brief review of laser-induced breakdown spectroscopy for human and animal soft tissues:Pathological diagnosis and physiological detection[J]. Applied Spectroscopy Reviews, 2021, 56(3): 221−241. doi: 10.1080/05704928.2020.1791151 [12] Chen S,Pei H L,Pisonero J,et al. Simultaneous determination of lithology and major elements in rocks using laser-induced breakdown spectroscopy (LIBS) coupled with a deep convolutional neural network[J]. Journal of Analytical Atomic Spectrometry, 2022, 37(3): 508−516. doi: 10.1039/D1JA00406A [13] 秦燕,徐衍明,侯可军,等. 铁同位素分析测试技术研究进展[J]. 岩矿测试, 2020, 39(2): 151−161. doi: 10.15898/j.cnki.11-2131/td.201908120120 Qin Y,Xu Y M,Hou K J,et al. Progress of analytical techniques for stable iron isotopes[J]. Rock and Mineral Analysis, 2020, 39(2): 151−161. doi: 10.15898/j.cnki.11-2131/td.201908120120 [14] 龚仓,丁洋,陆海川,等. 五酸溶样-电感耦合等离子体质谱法同时测定地质样品中的稀土等28种金属元素[J]. 岩矿测试, 2021, 40(3): 340−348. doi: 10.15898/j.cnki.11-2131/td.202011030136 Gong C,Ding Y,Lu H C,et al. Simultaneous determination of 28 elements including rare earth elements by ICP-MS with five-acid dissolution[J]. Rock and Mineral Analysis, 2021, 40(3): 340−348. doi: 10.15898/j.cnki.11-2131/td.202011030136 [15] Wang X,Chen S,Wu M F,et al. Low-cost smartphone-based LIBS combined with deep learning image processing for accurate lithology recognition[J]. Chemical Communications, 2021, 57(58): 7156−7159. doi: 10.1039/D1CC01844B [16] Sun C,Xu W J,Tan Y Q,et al. From machine learning to transfer learning in laser-induced breakdown spectroscopy analysis of rocks for Mars exploration[J]. Scientific Reports, 2021, 11(1): 21379. doi: 10.1038/s41598-021-00647-2 [17] Zhang D,Chu Y W,Ma S X,et al. A plasma-image-assisted method for matrix effect correction in laser-induced breakdown spectroscopy[J]. Analytica Chimica Acta, 2020, 1107: 14−22. doi: 10.1016/j.aca.2020.02.003 [18] Agresti J,Indelicato C,Perotti M,et al. Quantitative compositional analyses of calcareous rocks for lime industry using LIBS[J]. Molecules, 2022, 27(6): 1813. doi: 10.3390/molecules27061813 [19] Pagnotta S,Lezzerini M,Campanella B,et al. A new approach to non-linear multivariate calibration in laser-induced breakdown spectroscopy analysis of silicate rocks[J]. Spectrochimica Acta Part B-Atomic Spectroscopy, 2020, 166: 105804. doi: 10.1016/j.sab.2020.105804 [20] Hussain A,Xun G,Asghar H,et al. Enhancement of laser-induced breakdown spectroscopy (LIBS) signal subject to the magnetic confinement and dual pulses[J]. Optics and Spectroscopy, 2021, 129(4): 452−459. doi: 10.1134/S0030400X21040068 [21] Yang R Z,Bi L Q. Spectral enhancement mechanism and analysis of defocused collinear DP-LIBS technology[J]. Optik, 2021, 243: 167025. doi: 10.1016/j.ijleo.2021.167025 [22] Lu C X,Wang B,Jiang X P,et al. Detection of K in soil using time-resolved laser-induced breakdown spectroscopy based on convolutional neural networks[J]. Plasma Science & Technology, 2019, 21(3): 034014. [23] Yan J J,Hao Z Q,Zhou R,et al. A quantitative analysis method assisted by image features in laser-induced breakdown spectroscopy[J]. Analytica Chimica Acta, 2019, 1082: 30−36. doi: 10.1016/j.aca.2019.07.058 [24] Li Q Y,Tian Y,Xue B Y,et al. Improvement in the analytical performance of underwater LIBS signals by exploiting the plasma image information[J]. Journal of Analytical Atomic Spectrometry, 2020, 35(2): 366−376. doi: 10.1039/C9JA00367C [25] Porizka P,Demidov A,Kaiser J,et al. Laser-induced breakdown spectroscopy for in situ qualitative and quantitative analysis of mineral ores[J]. Spectrochimica Acta Part B-Atomic Spectroscopy, 2014, 101: 155−163. doi: 10.1016/j.sab.2014.08.027 [26] Sanchez-Esteva S,Knadel M,Labouriau R,et al. Total phosphorus determination in soils using laser-induced breakdown spectroscopy:Evaluating different sources of matrix effects[J]. Applied Spectroscopy, 2021, 75(1): 22−33. doi: 10.1177/0003702820949560 [27] Kosareva N,Krylovas A,Zavadskas E K. Statistical analysis of MCDM data normalization methods using Monte Carlo approach. The case of ternary estimates matrix[J]. Economic Computation and Economic Cybernetics Studies and Research, 2018, 52(4): 159−175. [28] Jia Y,Zhao N J,Fang L,et al. Online calibration of laser-induced breakdown spectroscopy for detection of heavy metals in water[J]. Plasma Science & Technology, 2018, 20(9): 095503. [29] Lu P,Zhuo Z,Zhang W H,et al. Determination of calorific value in coal by LIBS coupled with acoustic normalization[J]. Applied Physics B-Lasers and Optics, 2021, 127(6): 82. doi: 10.1007/s00340-021-07626-5 [30] 刘旭阳,张大成,冯中琦,等. 基于远程激光诱导击穿光谱技术的航空合金鉴别[J]. 光子学报, 2021, 50(10): 165−172. Liu X Y,Zhang D C,Feng Z Q,et al. Discrimination of aviation alloy by remote laser-induced breakdown spectroscopy technology[J]. Acta Photonica Sinica, 2021, 50(10): 165−172. [31] Zeng Q D,Chen G H,Li W X,et al. Classification of steel based on laser-induced breakdown spectroscopy combined with restricted Boltzmann machine and support vector machine[J]. Plasma Science & Technology, 2022, 24(8): 084009. [32] Yi R X,Li J M,Yang X Y,et al. Spectral interference elimination in soil analysis using laser-induced breakdown spectroscopy assisted by laser-induced fluorescence[J]. Analytical Chemistry, 2017, 89(4): 2334−2337. doi: 10.1021/acs.analchem.6b03969 [33] Liu X L,Rao Y M,Liu J G,et al. Quantitative analysis of gadolinium in thorium oxide matrix using laser-induced breakdown spectroscopy[J]. Applied Physics B-Lasers and Optics, 2022, 128(10): 192. doi: 10.1007/s00340-022-07914-8 [34] Martin M,Brice D,Martin S,et al. Inorganic characterization of switchgrass biomass using laser-induced breakdown spectroscopy[J]. Spectrochimica Acta Part B-Atomic Spectroscopy, 2021, 186: 106323. doi: 10.1016/j.sab.2021.106323 [35] Li J J,Chen F,Huang G Q,et al. Identification of Graves’ ophthalmology by laser-induced breakdown spectroscopy combined with machine learning method[J]. Frontiers of Optoelectronics, 2021, 14(3): 321−328. doi: 10.1007/s12200-020-0978-2 [36] Liu X N,Che X Q,Li K Y,et al. Geographical authenticity evaluation of Mentha haplocalyx by LIBS coupled with multivariate analyzes[J]. Plasma Science & Technology, 2020, 22(7): 074006. [37] 侯佳佳,张雷,赵洋,等. 基于共振与非共振双线的自吸收免疫LIBS技术研究[J]. 光谱学与光谱分析, 2020, 40(1): 261−265. Hou J J,Zhang L,Zhao Y,et al. Investigation on resonance and non-resonance doublet based self-absorption-free LIBS technique[J]. Spectroscopy and Spectral Analysis, 2020, 40(1): 261−265. [38] Guo Y M,Guo L B,Li J M,et al. Research progress in Asia on methods of processing laser-induced breakdown spectroscopy data[J]. Frontiers of Physics, 2016, 11(5): 114212. doi: 10.1007/s11467-016-0604-3 -
Access History
Figures(3)
Tables(3)

Export File
Citation
KONG Weiheng, ZENG Lingwei, RAO Yu, CHEN Sha, WANG Xu, YANG Yanting, DUAN Yixiang, FAN Qingwen. Laser-induced Breakdown Spectroscopy Based on Pre-classification Strategy for Quantitative Analysis of Rock Samples[J]. Rock and Mineral Analysis, 2023, 42(4): 760-770. doi: 10.15898/j.ykcs.202212190234
Format
Content
 DownLoad:

-
Figure 1.
Flow chart of spectral data processing.
-
Figure 2.
The quantitative analysis results of the two methods are compared on the training set and test set. (a-d) is the correlation curve without classification, and (e-h) is the pre-classification quantitative correlation curve.
-
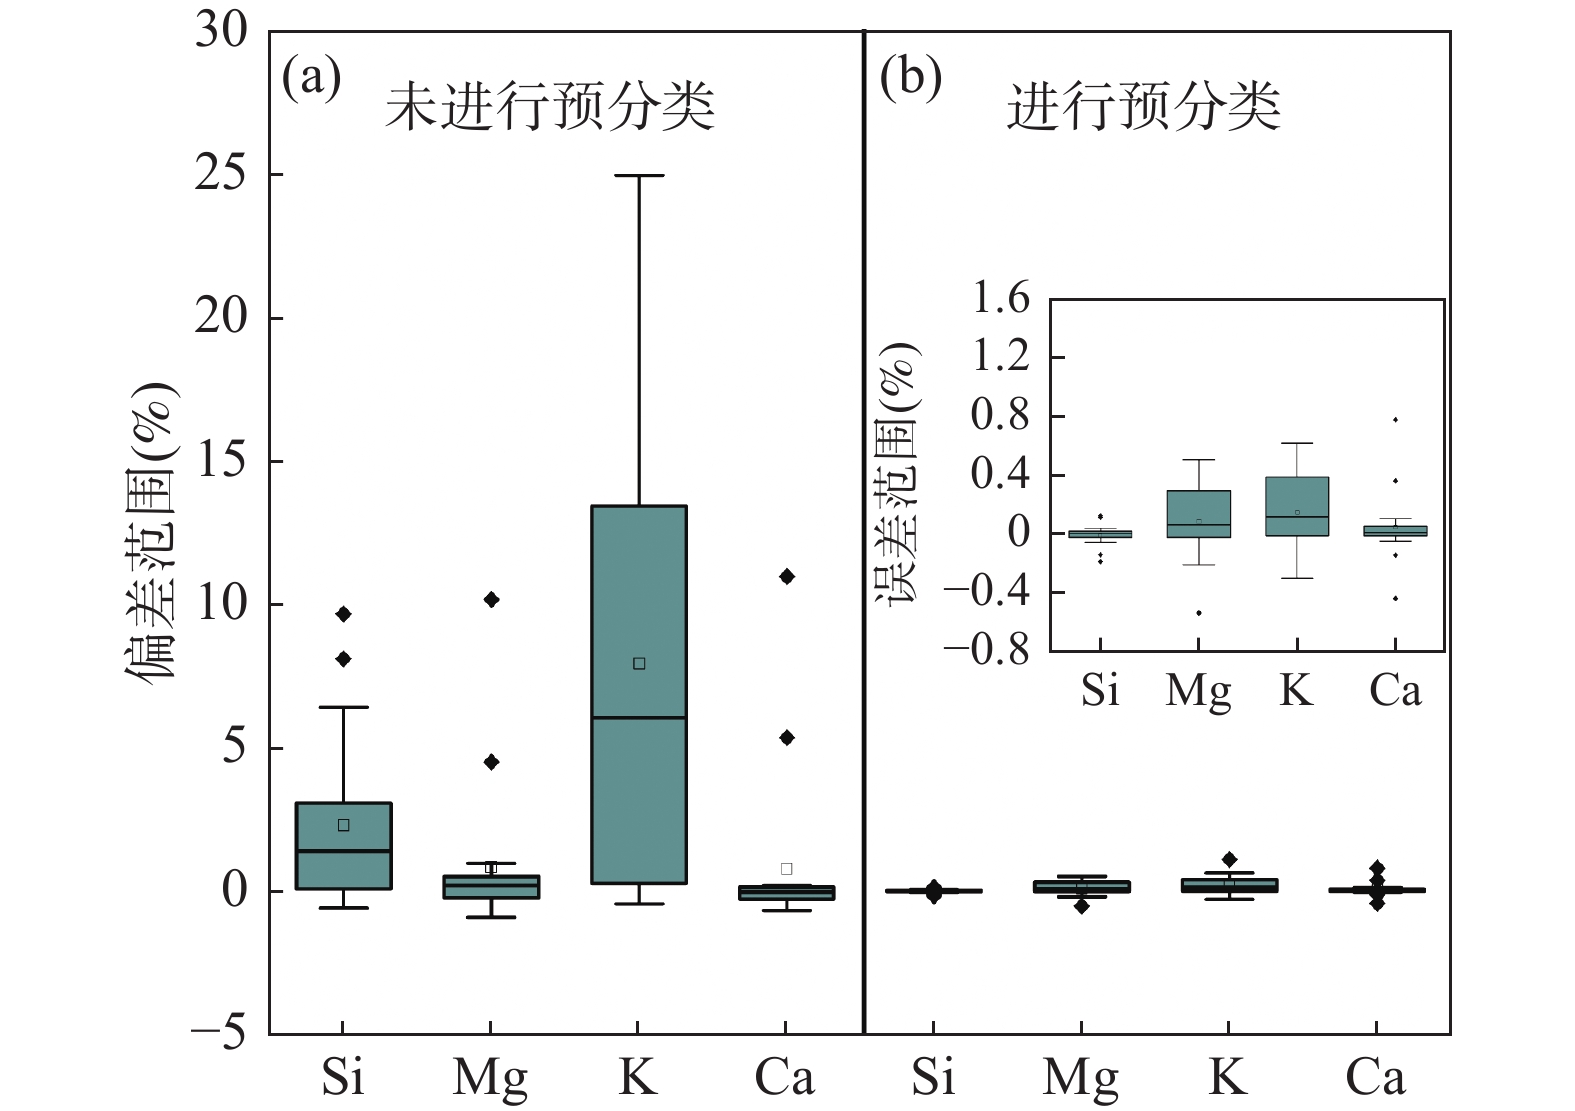
Figure 3.
Comparison of box line plots of deviation ranges of four elements in two methods: (a) Box line diagram of deviation ranges for Si, Mg, K and Ca without pre-classification method; (b) Box line diagram of deviation ranges of Si, Mg, K and Ca using pre-classification method.