
| Qingdao Institute of marine geology, China Geological Survey | Host |
| Citation: |
WANG Zhenxi, LIANG Yongqi, GAO Pan, QIAN Na, ZHOU Liping. Ocean data visualization software (ODV and JOA) and new applications in marine geochemical studies[J]. Marine Geology Frontiers, 2024, 40(9): 96-108. doi: 10.16028/j.1009-2722.2022.032

|
Ocean data visualization software (ODV and JOA) and new applications in marine geochemical studies
-
Abstract
Climate and biogeochemical cycle are important issues in marine sciences research fields, and the demand for fully utilizing and deeply mining marine geochemical data is growing.The internal structure of the ocean is complex and the interaction processes are diverse. The study of the internal mechanism and biogeochemical cycle of the ocean usually requires collaborative analysis of various marine physical and chemical parameters. Therefore, ocean data visualization software becomes more and more important. At present, there are few Chinese guides on the use of ocean data visualization software. Detailed description of operation level is required. Here we outline the basic functions of two data visualization softwares: Ocean Data View (ODV) and Java OceanAtlas (JOA), and provide a detailed practical guide on the production of map, section, surface, scatter, station and waterfall for the visualization, with a comparison of the differences between the two software. We also give examples of some new applications of ODV within the broad field of marine geochemistry.
-
Keywords:
- data visualization /
- Ocean Data View /
- Java OceanAtlas /
- marine geochemistry
-

-
References
[1] WILLIAMS R G,FOLLOWS M J. Ocean Dynamics and the Carbon Cycle:Principles and Mechanisms[M]. Cambridge:Cambridge University Press,2011. [2] 李崇银. 当代气候研究计划[J]. 新疆气象,2002,5:1-4. LI Chongyin. Introduction of the contemporary climate research program[J]. Desert and Oasis Meteorology,2002,5:1-4. [3] 段晓勇,孔祥淮,印萍,等. 全球海洋地球化学调查进展[J]. 海洋地质前沿,2020,36(7):1-10. DUAN Xiaoyong, KONG Xianghuai, YIN Ping, et al. A progress review of the marine geochemical survey in the world[J]. Marine Geology Frontiers,2020,36(7):1-10. [4] BROWN M. Ocean Data View 4.0[J]. Oceanography,1998,11(2):19-21. doi: 10.5670/oceanog.1998.04 [5] Alfred Wegener Institute. Ocean Data View User's Guide (version 5.6.6)[EB/OL]. https://odv.awi.de/fileadmin/user_upload/odv/misc/odvGuide.pdf/. [6] MAWJI E,SCHLITZER R,DODAS E M,et al. The GEOTRACES Intermediate Data Product 2014[J]. Marine Chemistry,2015,177:1-8. doi: 10.1016/j.marchem.2015.04.005 [7] SWIFT J H,OSBORNE J. Java OceanAtlas User Guide (third edition)[EB/OL]. https://joa.ucsd.edu/assets/documents/JOA5_userguide.pdf/. [8] STUIVER M,ÖSTLUND H G. GEOSECS Indian Ocean and Mediterranean Radiocarbon[J]. Radiocarbon,1983,25(1):1-29. doi: 10.1017/S0033822200005270 [9] NOWLIN W D. WOCE Planning Report Series[J]. Bulletin of the American Meteorological Society,1985,66(11):628-628. [10] World Climate Research Programme. CLIVAR,a study of climate variability and predictability:science plan[R]. Geneva:WMO,1995. [11] SCOR Working Group. GEOTRACES:an international study of the global marine biogeochemical cycles of trace elements and their isotopes[J]. Chemie der Erde Geochemistry Interdisciplinary Journal for Chemical Problems of the Geosciences and Geoecology,2007,67(2):85-131. [12] 王文芳,李薛,黄雄杰,等. 海洋视图软件(ODV)关键技术及应用[J]. 现代计算机(专业版),2016(2):20-25. WANG Wenfang, LI Xue, HUANG Xiongjie, et al. The key technologies and applications of Ocean Data View software(ODV)[J]. Modern Computer,2016(2):20-25. [13] 林建国. 海洋数据视图软件在资料处理中的应用[J]. 海洋测绘,2001(3):62-64. LIN Jianguo. The application of Ocean Data View software in data processing[J]. Hydroaphic Surveying and Charting,2001(3):62-64. [14] 周雅静,林建国. 海洋数据视图应用软件:ODV[J]. 海洋技术,2002,21(2):41-43. ZHOU Yajing, LIN Jianguo. The application software package of Ocean Data View[J]. Ocean Technology,2002,21(2):41-43. [15] 李帅,郭俊如,姜晓轶,等. 海洋水文气象多时空尺度资料来源分析[J]. 海洋通报,2020,39(1):24-39. LI Shuai, GUO Junru, JIANG Xiaoyi, et al. Sources and analysis of multi-temporal-spatial scale marine hydrometeorology data[J]. Marine Science Bulletin,2020,39(1):24-39. [16] SCHLITZER R,ANDERSON R F,DODAS E M,et al. The GEOTRACES Intermediate Data Product 2017[J]. Chemical Geology,2018,493:210-223. doi: 10.1016/j.chemgeo.2018.05.040 [17] TURNER D,URBAN E. GEOTRACES:high-quality marine analytical chemistry on a global scale[J]. Chemistry International,2016,38(1):16-17. [18] TALLEY L,PICKARD G,EMERY,W,et al. Descriptive Physical Oceanography:An Introduction (6th ed.) [M]. Boston:Academic Press,2011:179. [19] CASACUBERTA N,CHRISTL M,VOCKENHUBER C,et al. Tracing the Three Atlantic branches entering the Arctic Ocean with 129I and 236U[J]. Journal of Geophysical Research:Oceans,2018,123(9):6909-6921. [20] LAMBELET M,VAN DE FLIERDT T,CROCKET K,et al. Neodymium isotopic composition and concentration in the western North Atlantic Ocean:results from the GEOTRACES GA02 section[J]. Geochimica et Cosmochimica Acta,2016,177:6909-6921. [21] ZHENG L,SOHRIN Y. Major lithogenic contributions to the distribution and budget of iron in the North Pacific Ocean[J]. Scientific Reports,2019,9(1):11652. doi: 10.1038/s41598-019-48035-1 [22] GAO P,ZHOU L P,LIU K X,et al. Radiocarbon in the maritime air and sea surface water of the South China Sea[J]. Radiocarbon,2018,61(2):1-12. [23] GAO P,QIAN N,ZHOU L P,et al. Decadal changes of seawater radiocarbon in the eastern tropical Indian Ocean and their oceanographic implications[J]. Journal of Marine Systems,2020,213:103453. [24] SARNTHEIN M,SCHNEIDER B,AND GROOTES P M. Peak glacial 14C ventilation ages suggest major draw-down of carbon into the abyssal ocean[J]. Climate Past,2013,9:2595-2614. doi: 10.5194/cp-9-2595-2013 [25] YU J,MENVIEL L,JIN Z D,et al. Last glacial atmospheric CO2 decline due to widespread Pacific deep-water expansion[J]. Nature Geoscience,2020,13:628-633. [26] TALLEY L D,GEORGE L P,EMERY W J,et al. Descriptive Physical Oceanography:An Introduction[M]. Boston:Academic Press,2011. [27] SCHLITZER R. Interactive analysis and visualization of geoscience data with Ocean Data View[J]. Computers and Geosciences,2002,28(10):1211-1218. doi: 10.1016/S0098-3004(02)00040-7 -
Access History
Figures(11)
Tables(6)

Export File
Citation
WANG Zhenxi, LIANG Yongqi, GAO Pan, QIAN Na, ZHOU Liping. Ocean data visualization software (ODV and JOA) and new applications in marine geochemical studies[J]. Marine Geology Frontiers, 2024, 40(9): 96-108. doi: 10.16028/j.1009-2722.2022.032
Format
Content
 DownLoad:


-
Figure 1.
ODV data visualization operation procedures and relevant chapters in the User's Guide [5]
-
Figure 2.
NORC581 voyage (November 2020 to January 2021) stations and GLODAP database stations by ODV
-
Figure 3.
A still picture from the 3D-animation of distribution of dissolved iron in the Atlantic Ocean [17]
-
Figure 4.
Data visualization process of JOA [7]
-
Figure 5.
The seawater CFC-12 concentration data of WOCE cross-section visualized by ODV (a) and JOA (b) respectively [9]
-
Figure 6.
The seawater dissolved 230Th concentration, salinity, temperature and pressure data of eGEOTRACES cross-section visualized by ODV[6]
-
Figure 7.
Visualization and comparison of Δ14C data of the GEOSECS section in the East Indian Ocean
-
Figure 8.
Δ14C distribution of marine air CO2 (left) and surface seawater DIC (right) in the South China Sea [22]
-
Figure 9.
The intrusion depth of bomb 14C in the equatorial Eastern Indian Ocean deepens with time [23]
-
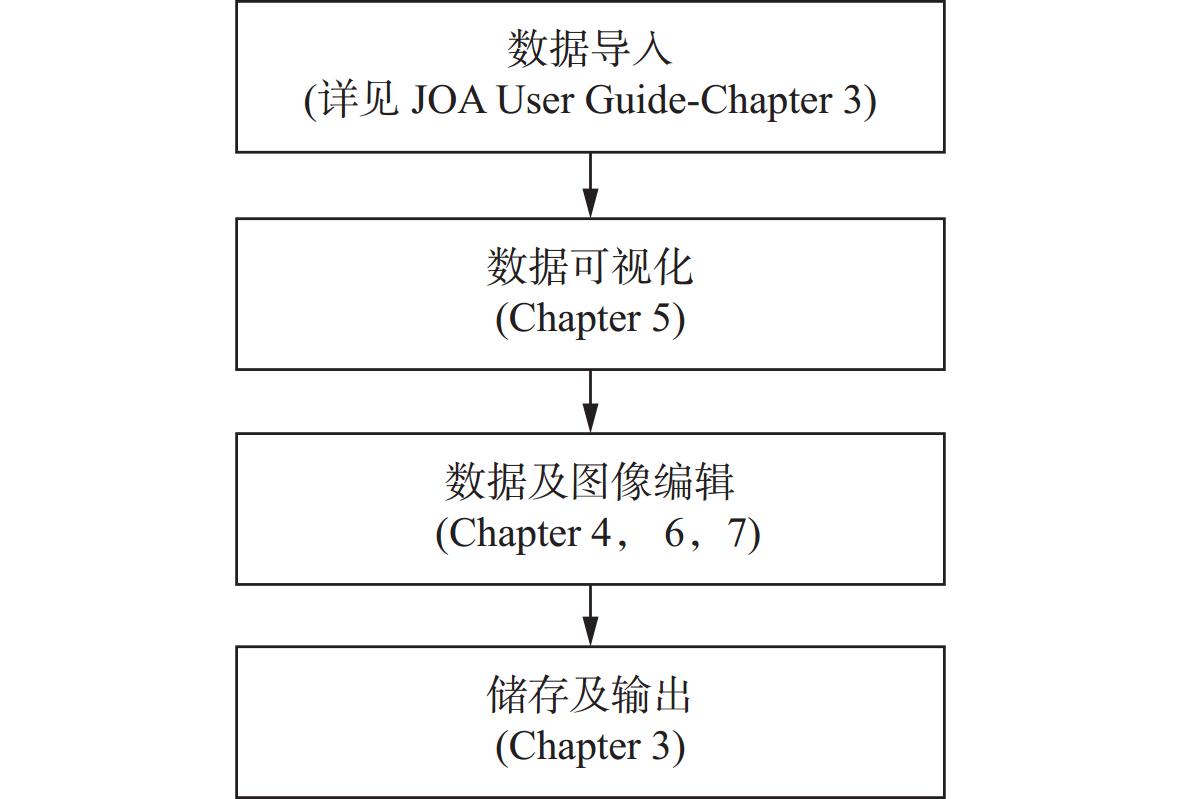
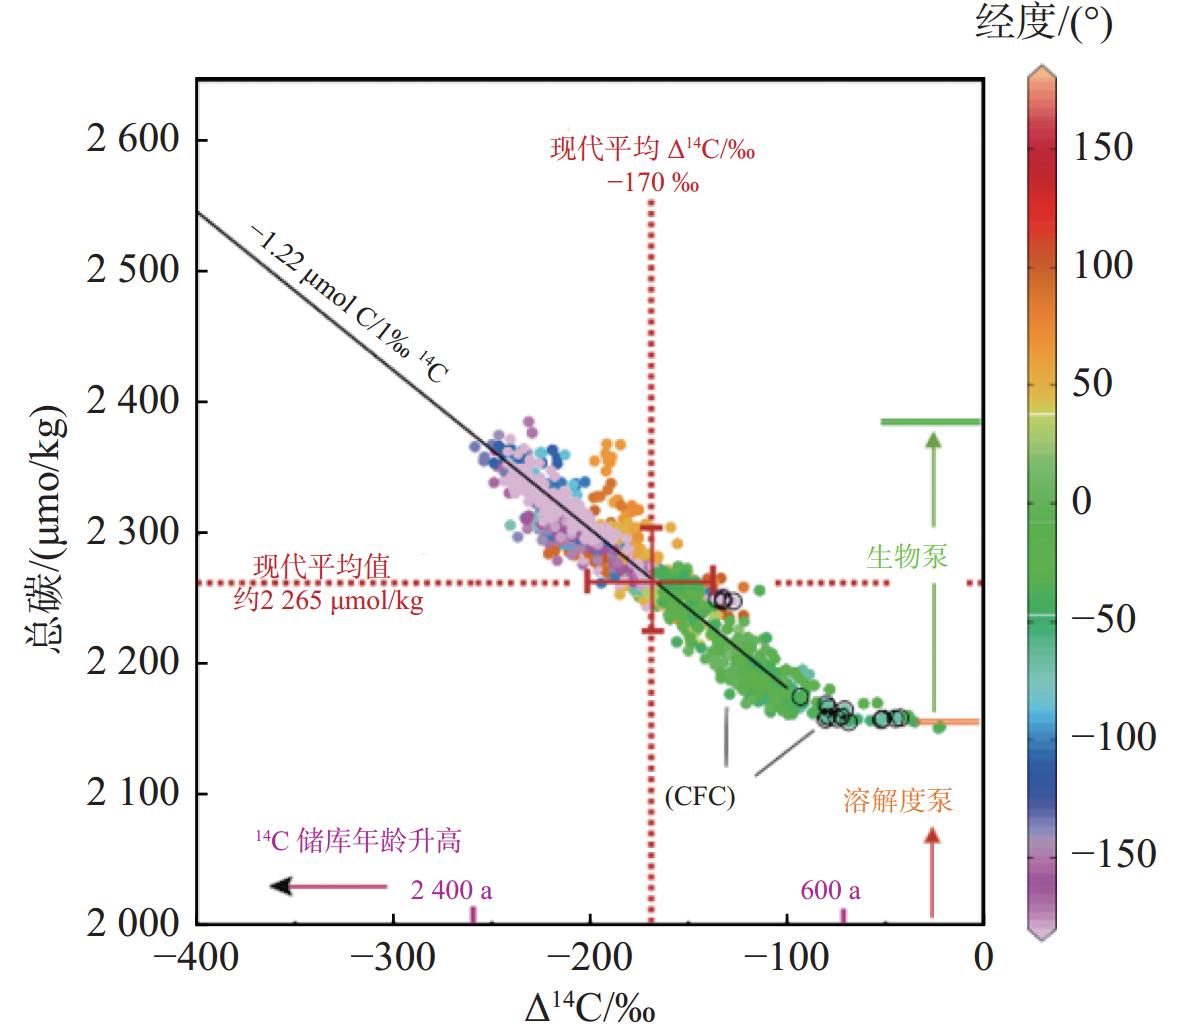
Figure 10.
The changes of 14C age of modern deep sea water away from the formation area of deep water[24]
-
Figure 11.
Modern and LGM Atlantic meridional (CO32–) transects [25]