
| Citation: |
CAI Huihui, XU Yongyang, LI Zixuan, CAO Haohao, FENG Yaxing, CHEN Siqiong, LI Yongsheng. The division of metallogenic prospective areas based on convolutional neural network model: A case study of the Daqiao gold polymetallic deposit[J]. Geological Bulletin of China, 2019, 38(12): 1999-2009.

|
The division of metallogenic prospective areas based on convolutional neural network model: A case study of the Daqiao gold polymetallic deposit
-
Abstract
Big data and high performance computing make it possible for geology to break through the limitations of various subjective and objective factors and transform from the traditional qualitative description and uncertainty to a more comprehensive quantitative development stage, that is, geology pays more attention to exploring the geological genesis process by mining the correlation between complex and multiple geoscience data. In order to clarify the diversity of geological data in the study area and divide the metallogenic prospective area, the authors aimed to help the geoscientists to make decisions intelligently and efficiently by combining the new methods and technologies of modern informatization. With the Daqiao gold deposit in Gansu Province as the study area, the authors proposed to use one-dimensional convolutional neural network instead of traditional manual calculation and, through training the geochemical and geophysical element data in the study area, excavated the comprehensive metallogenic information in the study area, and then recognized four types of metallogenic prospective areas based on the training results. The results show that the geological mineralization process is complex, and each element of metallogenic prediction plays an important role in the geological mineralization process. On a large scale, the deep learning network model can objectively reflect the nonlinear characteristics of diversified geological data, identify the spatial characteristics of geological elements, extract and excavate the information of mineralization anomalies, and realize the intelligent prediction and evaluation of mineral resources.
-
Keywords:
- convolutional neural network /
- model /
- metallogenic prospective area /
- Daqiao /
- orefield
-

-
References
[1] 严光生, 薛群威, 肖克炎, 等.地质调查大数据研究的主要问题分析[J].地质通报, 2015, 34(7):1273-1279. [2] Chen L R, Guan Q F, Xiong Y H, et al. A Spatially Constrained Multi-autoencoder Approach for Multivariate Geochemical Anomaly Recognition[J]. Computers and Geosciences, 2019:43-54. [3] 陈建平, 李靖, 崔宁, 等.大数据背景下的地质云的构建[J].地质通报, 2015, 34(7):1260-1265. [4] Chen L R, Guan Q F, Feng B, et al. AMulti-convolutional Autoencoder Approach to Multivariate Geochemical Anomaly Recognition[J]. Minerals, 2019:1-23. [5] 蔡惠慧, 朱伟, 李孜轩, 等.基于深度学习的钨钼多金属矿矿产资源预测评价[J].地球信息科学学报, 2019, (6): [6] Xiong Y H, Zuo R G. Recognition of Geochemical Anomalies Using a Deep Autoencoder Network[J]. Computers & Geosciences, 2016:75-82. [7] 吴冲龙, 刘刚.大数据与未来地质的发展[J].地质通报, 2019, 38(7):1081-1088. [8] 吴冲龙, 刘刚, 张夏林, 等.地质科学大数据及其利用的若干问题探讨[J].科学通报, 2016, 61(16):1797-1807. [9] 李德仁, 王树良, 李德毅.空间数据挖掘理论与应用[M].北京:科学出版社, 2013. [10] 周飞燕, 金林鹏, 董军.卷积神经网络研究综述[J].计算机学报, 2017, 40(6):1229-1251. [11] 刘月高, 吕新彪, 张振杰, 等.甘肃西和县大桥金矿床的成因研究[J].矿床地质, 2011, 30(6):1085-1099. [12] 卢欣祥, 董有, 常秋玲, 等. Indosinian Shahewan rapakivi granite in Qinling and its dynamic significance[J]. Science in China, 1996, 39(3):266-272. [13] 张宗清, 张国伟, 唐索寒, 等.秦岭沙河湾奥长环斑花岗岩的年龄及其对秦岭造山带主造山期结束时间的限制[J].科学通报, 1999, 44(9):981-984. [14] Zhong N C. Wang W. Yao P, et al. Prevalence of chronic obstructive pulmonary disease in China: a large, population-based survey[J]. American Journal of Respiratory & Critical Care Medicine, 2006, 176(8): 753. [15] 刘建宏, 张新虎, 赵彦庆, 等.西秦岭成矿系列、成矿谱系研究及其找矿意义[J].矿床地质, 2006, 25(6):727-734. [16] 闫玉梅, 李永军.西秦岭礼县长安一带西汉水群牙形刺特征及时代讨论[J].甘肃地质, 1994, (2):18-26. [17] 张复新, 季军良, 龙灵利, 等.南秦岭卡林型-似卡林型金矿床综合地质地球化学特征[J].地质论评, 2001, 47(5):492-499. [18] 尤关进, 张忠平.甘肃大桥金矿地质特征及其发现的意义[J].甘肃地质, 2009, 18(4):1-8. [19] 李永琴, 赵建群, 赵彦庆.西秦岭金成矿系统分析[J].甘肃地质, 2006, 15(1):47-52. [20] 孙则明, 王自翔, 徐亮, 等.甘肃大桥金矿硅质岩地球化学特征及其地质意义探讨[J].地球化学, 2016, 45(5):499-509. [21] 张凤霞, 吴玉雯, 张玉辉, 等.甘肃大桥金矿地球化学异常特征对比[J].甘肃地质, 2015, 24(3):36-41. [22] 常亮, 邓小明, 周明全, 等.图像理解中的卷积神经网络[J].自动化学报, 2016, 42(9):1300-1312. [23] 张文宇, 刘畅.卷积神经网络算法在语音识别中的应用[J].信息技术, 201, 8(10): 147-152. -
Access History
Figures(11)
Tables(3)

Export File
Citation
CAI Huihui, XU Yongyang, LI Zixuan, CAO Haohao, FENG Yaxing, CHEN Siqiong, LI Yongsheng. The division of metallogenic prospective areas based on convolutional neural network model: A case study of the Daqiao gold polymetallic deposit[J]. Geological Bulletin of China, 2019, 38(12): 1999-2009.
Format
Content
 DownLoad:

-
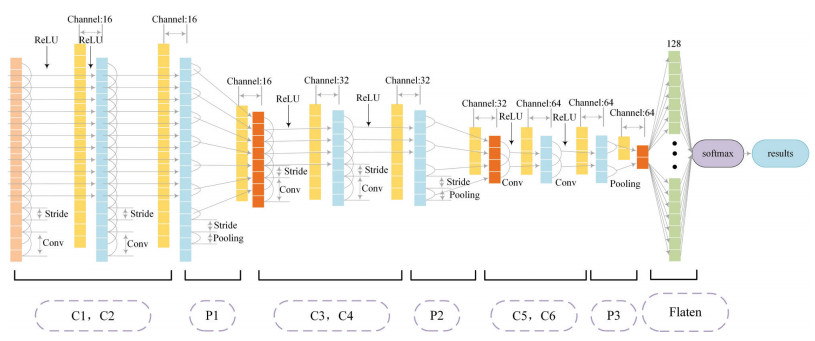
Figure 1.
Structural diagram of one-dimensional convolutional ore-prospecting prediction neural network
-
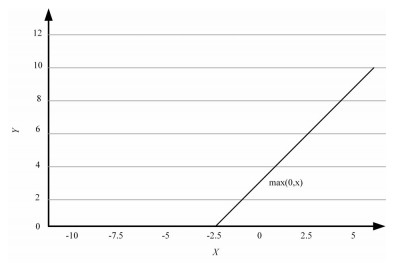
Figure 2.
Schematic diagram of activation function
-
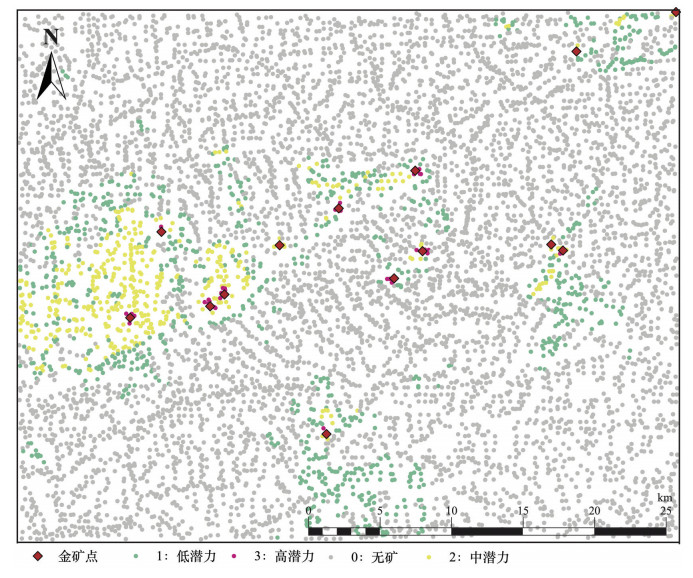
Figure 3.
The sample learning point of neural network classification model
-
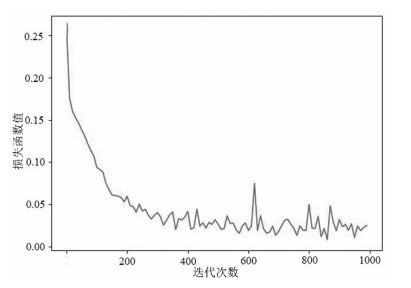
Figure 4.
Trend diagram of model loss function under different iteration rounds of network model
-
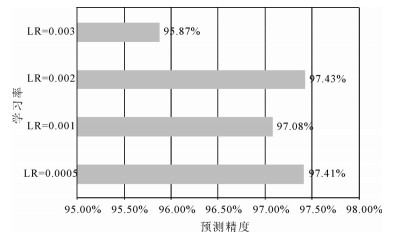
Figure 5.
Prediction accuracy diagram at different learning rates
-
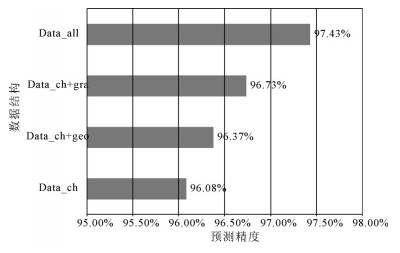
Figure 6.
Prediction accuracy of different data structures when the learning rate is 0.002
-
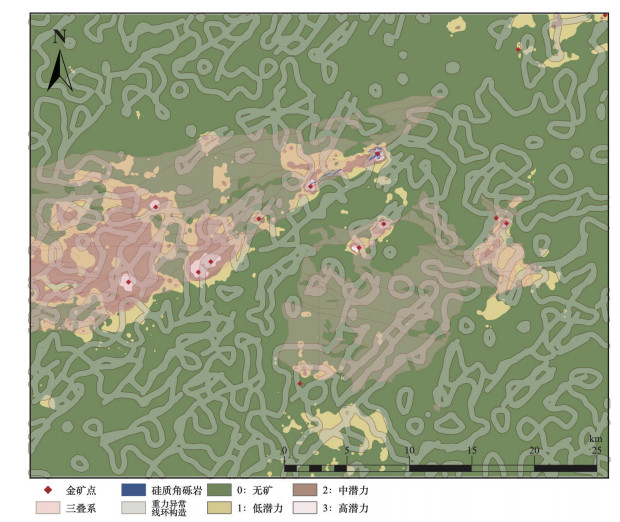
Figure 7.
Classification network model comprehensive information prediction diagram
-
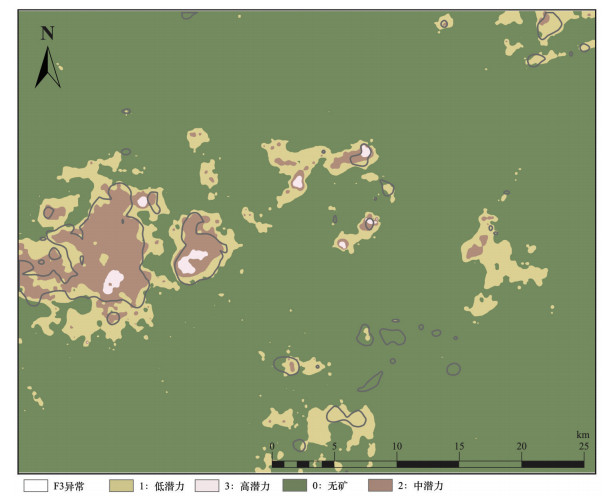
Figure 8.
Comparison between prediction results of geochemical data network model and F3 anomaly
-
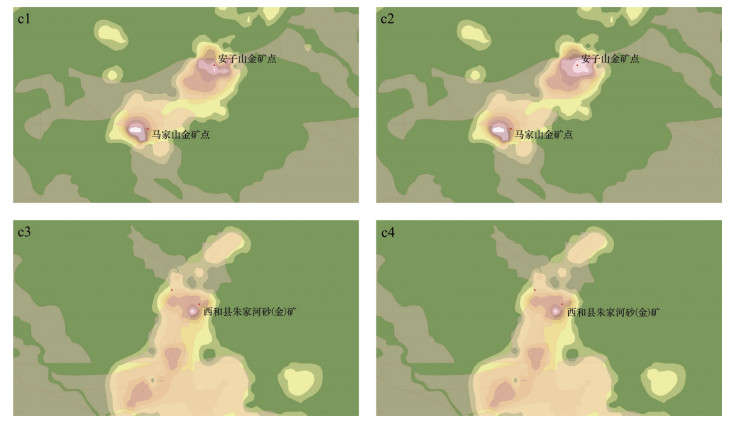
Figure 9.
Results before and after geochemical data overlaid with geophysical data (c1 and c3: before superposition; c2 and c4: after superimposition)
-
Figure 10.
Results before and after geochemical data overlaid with geological data (d1: before the superposition; d2: superimposed)
-
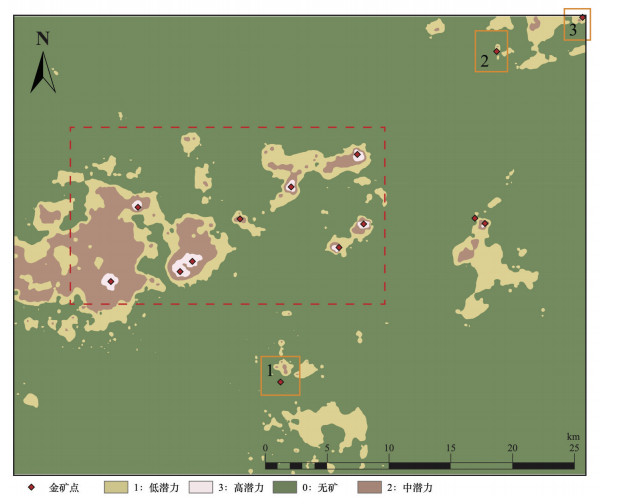
Figure 11.
Prediction diagram of deep convolutional neural network model (dotted box with 9 perspective areas)