| Citation: | Xue-yang Yu, Si-yuan Ye, Li-xin Pei, Liu-juan Xie, Ken W. Krauss, Samantha K. Chapman, Hans Brix, 2023. Biophysical warming patterns of an open-top chamber and its short-term influence on a Phragmites wetland ecosystem in China, China Geology, 6, 594-610. doi: 10.31035/cg2022064 |
Biophysical warming patterns of an open-top chamber and its short-term influence on a Phragmites wetland ecosystem in China
-
Abstract
Passive-warming, open-top chambers (OTCs) are widely applied for studying the effects of future climate warming on coastal wetlands. In this study, a set of six OTCs were established at a Phragmites wetland located in the Yellow River Delta of Dongying City, China. With data collected through online transmission and in-situ sensors, the attributes and patterns of realized OTCs warming are demonstrated. The authors also quantified the preliminary influence of experimental chamber warming on plant traits. OTCs produced an elevated average air temperature of 0.8°C (relative to controls) during the growing season (June to October) of 2018, and soil temperatures actually decreased by 0.54°C at a depth of 5 cm and 0.46°C at a depth of 30 cm in the OTCs. Variations in diel patterns of warming depend greatly on the heat sources of incoming radiation in the daytime versus soil heat flux at night. Warming effects were often larger during instantaneous analyses and influenced OTCs air temperatures from −2.5°C to 8.3°C dependent on various meteorological conditions at any given time, ranging from cooling influences from vertical heat exchange and vegetation to radiation-associated warming. Night-time temperature depressions in the OTCs were due to the low turbulence inside OTCs and changes in surface soil-atmosphere heat transfer. Plant shoot density, basal diameter, and biomass of Phragmites decreased by 23.2%, 6.3%, and 34.0%, respectively, under experimental warming versus controls, and plant height increased by 4.3%, reflecting less carbon allocation to stem structures as plants in the OTCs experienced simultaneous wind buffering. While these passive-warming OTCs created the desired warming effects both to the atmosphere and soils, pest damages on the plant leaves and lodging within the OTCs were extensive and serious, creating the need to consider control options for these chambers and the replicated OTCs studies underway in other Chinese Phragmites marshes (Panjin and Yancheng).
-

-
References
Adler LS, Valpine PD, Harte J, Call J. 2007. Effects of long-term experimental warming on Aphid density in the field. Journal of the Kansas Entomological Society, 80(2), 156–168. doi: 10.2317/0022-8567(2007)80[156:EOLEWO]2.0.CO;2. Aronson EL, Mcnulty SG, Sun G, Sun JX, Zhou GS. 2009. Appropriate experimental ecosystem warming methods by ecosystem, objective, and practicality. Agricultural and Forest Meteorology, 149(11), 1791–1799. doi: 10.1016/j.agrformet.2009.06.007. Baldwin AH, Jensen K. 2014. Warming increases plant biomass and reduces diversity across continents, latitudes, and species migration scenarios in experimental wetland communities. Global Change Biology, 20(3), 835–850. doi: 10.1111/gcb.12378. Bale JS, Masters GJ, Hodkinson ID, Awmack C, Bezemer TM, Brown VK, Butterfield J, Buse A, Coulson JC, Farrar J, Good JEG, Harrington R, Hartley S, Jones TH, Lindroth RL, Press MC, Symrnioudis I, Watt AD, Whittaker JB. 2002. Herbivory in global climate change research: direct effects of rising temperature on insect herbivores. Global Change Biology, 8(1), 1–16. doi: 10.1046/j.1365-2486.2002.00451.x. Baruah G, Molau U, Bai Y, Alatalo JM. 2017. Community and species-specific responses of plant traits to 23 years of experimental warming across subarctic tundra plant communities. Scientific Reports, 7, 2571. doi: 10.1038/s41598-017-02595-2. Bondlamberty B, Thomson A. 2010. Temperature-associated increases in the global soil respiration record. Nature, 464(7288), 579–582. doi: 10.1038/nature08930. Burt MA, Dunn RR, Nichols LM, Sanders NJ. 2016. Interactions in a warmer world: Effects of experimental warming, conspecific density, and herbivory on seedling dynamics. Ecosphere, 5(1), 1–12. doi: 10.1890/ES13-00198.1. Carey JC, Kroeger KD, Zafari B, Tang JW. 2018. Passive experimental warming decouples air and sediment temperatures in a salt marsh. Limnology and Oceanography: Methods, 16, 640–648. doi: 10.1002/lom3.10270. Carey JC, Tang J, Templer PH, Kroeger KD, Crowther TW, Burton AJ, Dukes JS, Emmett B, Frey SD, Heskel MA. 2016. Temperature response of soil respiration largely unaltered with experimental warming. Proceedings of the National Academy of Sciences of the United States of America, 113(48), 13797. doi: 10.1073/pnas.1605365113. Charles H, Dukes JS. 2009. Effects of warming and altered precipitation on plant and nutrient dynamics of a New England Salt Marsh. Ecological Applications, 19(7), 1758–1773. doi: 10.1890/08-0172.1. Chen J, Luo YQ, Xia JY, Zheng S, Jiang LF, Niu SL, Zhou XH, Cao JJ. 2016. Differential responses of ecosystem respiration components to experimental warming in a meadow grassland on the Xizang Plateau. Agricultural and Forest Meteorology, 220, 21–29. doi: 10.1016/j.agrformet.2016.01.010. Cornelius C, Heinichen J, Drösler M, Menzel A. 2015. Impacts of temperature and water table manipulation on grassland phenology. Applied Vegetation Science, 17(4), 625–635. doi: 10.1111/avsc.12105. Crowther TW, Toddbrown KEO, Rowe CW, Wieder WR, Carey JC, Machmuller MB, Snoek BL, Fang S, Zhou G, Allison SD. 2016. Quantifying global soil carbon losses in response to warming. Nature, 540(7631), 104–108. doi: 10.1038/nature20150. Day TA, Ruhland CT, Xiong FS. 2010. Warming increases aboveground plant biomass and C stocks in vascular-plant-dominated Antarctic tundra. Global Change Biology, 14(8), 1827–1843. doi: 10.1111/j.1365-2486.2008.01623.x. Deegan LA, Johnson DS, Warren RS, Peterson BJ, Fleeger JW, Fagherazzi S, Wollheim WM. 2012. Coastal eutrophication as a driver of salt marsh loss. Nature, 490(7420), 388–392. doi: 10.1038/nature11533. de Valpine P, Harte J. 2001. Plant responses to experimental warming in a montane meadow. Ecology, 82(3), 637–648. doi: 10.1890/0012-9658(2001)082[0637:PRTEWI]2.0.CO;2. Ding YR, Ye SY, Zhao QS. 2012. Nutrients and carbon sequestration in the newly created wetlands of the Yellow River Delta. Geological Review, 58(1), 183–189 (in Chinese with English abstract). doi: 10.16509/j.georeview.2012.01.009. Edith B, Li SL, Xu WH, Li W, Dai WW, Jiang P. 2013. A meta-analysis of experimental warming effects on terrestrial nitrogen pools and dynamics. New Phytologist, 199(2), 441–451. doi: 10.1111/nph.12252. Fu G, Zhang XZ, Zhang YJ, Shi PL, Li YL, Zhou YT, Yang PW, Shen ZX. 2013. Experimental warming does not enhance gross primary production and above-ground biomass in the alpine meadow of Xizang. Journal of Applied Remote Sensing, 7(7), 6451–6465. doi: 10.1117/1.JRS.7.073505. Grogan P, Chapin III FS. 2000. Initial effects of experimental warming on above and belowground components of net ecosystem CO2 exchange in arctic tundra. Oecologia, 125(4), 512–520. doi: 10.1007/s004420000490. Hawkins E, Ortega P, Suckling E, Schurer A, Hegerl G, Jones P, Joshi M, Osborn TJ, Masson-Delmotte V, Mignot J, Thorne P, Oldenborgh GJ. 2017. Estimating changes in global temperature since the Preindustrial Period. Bulletin of the American Meteorological Society, 98(9), 1841–1856. doi: 10.1175/bams-d-16-0007.1. Henry GHR, Molau U. 2010. Tundra plants and climate change: The International Tundra Experiment (ITEX). Global Change Biology, 3(S1), 1–9. doi: 10.1111/j.1365-2486.1997.gcb132.x. Hobbie SE, Chapin III FS. 1998. The response of tundra plant biomass, aboveground production, nitrogen, and CO2 flux to experimental warming. Ecology, 79(5), 1526–1544. doi: 10.1890/0012-9658(1998)079[1526:TROTPB]2.0.CO;2. Hollister RD, Webber PJ, Nelson FE, Tweedie CE. 2006. Soil thaw and temperature response to air warming varies by plant community: Results from and open-top chamber experiment in northern Alaska. Arctic Antarctic and Alpine Research, 38(2), 206–215. doi: 10.1657/1523-0430(2006)38[206:STATRT]2.0.CO;2. IPCC. 2013. Climate Change 2013: The Physical Science Basis. Contribution of Working Group I to the Fifth Assessment Report of the Intergovernmental Panel on Climate Change. Cambridge, Cambridge University Press, 1535. IPCC. 2022. Global Warming of 1.5°C: IPCC Special Report on Impacts of Global Warming of 1.5°C above Pre-industrial Levels in Context of Strengthening Response to Climate Change, Sustainable Development, and Efforts to Eradicate Poverty. Cambridge, Cambridge University Press. doi: 10.1017/9781009157940. King G, Adamsen A. 1992. Effects of temperature on methane consumption in a forest soil and in pure cultures of the methanotroph Methylomonas rubra. Applied and Environmental Microbiology, 58(9), 2758–2763. doi: 10.1128/aem.58.9.2758-2763.1992. Körner C, Basler D. 2010. Plant science. Phenology under global warming. Science, 327(5972), 1461–1462. doi: 10.1126/science.1186473. Li JW, Ziegler SE, Lane CS, Billings SA. 2015. Warming-enhanced preferential microbial mineralization of humified boreal forest soil organic matter: Interpretation of soil profiles along a climate transect using laboratory incubations. Journal of Geophysical Research Biogeosciences, 117(G2), 502–504. doi: 10.1029/2011JG001769. Liu J, Ye SY, Yuan HM, Ding XG, Zhao GM, Yang SX, He L, Wang J, Pei SF, Huang XY. 2018. Metal pollution across the upper delta plain wetlands and its adjacent shallow sea wetland, northeast of China: Implications for the filtration functions of wetlands. Environmental Science and Pollution Research, 25(6), 5934–5949. doi: 10.1007/s11356-017-0912-3. Liu Y, Mu J, Niklas KJ, Li G, Sun S. 2012. Global warming reduces plant reproductive output for temperate multi-inflorescence species on the Xizang plateau. New Phytologist, 195(2), 427–436. doi: 10.1111/j.1469-8137.2012.04178.x. Liu YZ, Reich PB, Li GY, Sun SC. 2011. Shifting phenology and abundance under experimental warming alters trophic relationships and plant reproductive capacity. Ecology, 92(6), 1201–1208. doi: 10.1890/10-2060.1. Macdonald JA, Fowler D, Hargreaves KJ, Skiba U, Leith ID, Murray MB. 1998. Methane emission rates from a northern wetland: Response to temperature, water table and transport. Atmospheric Environment, 32(19), 3219–3227. doi: 10.1016/S1352-2310(97)00464-0. Marion GM, Ghr H, Freckman DW, Johnstone J, Jones G, Jones MH, Lévesque E, Molau U, Mølgaard P, Parsons AN. 1997. Open-top designs for manipulating field temperature in high-latitude ecosystems. Global Change Biology, 3(S1), 20–32. doi: 10.1111/j.1365-2486.1997.gcb136.x. Mcelroy DJ, O’Gorman EJ, Schneider FD, Hetjens H, Merrer PL, Coleman RA, Emmerson M. 2015. Size-balanced community reorganization in response to nutrients and warming. Global Change Biology, 21(11), 3971–3981. doi: 10.1111/gcb.13019. Meng L, Roulet N, Zhuang QL, Christensen TR, Frolking S. 2016. Focus on the impact of climate change on wetland ecosystems and carbon dynamics. Environmental Research Letters, 11(10), 100201. doi: 10.1088/1748-9326/11/10/100201. Mozdzer TJ, Caplan JS. 2018. Complementary responses of morphology and physiology enhance the stand-scale production of a model invasive species under elevated CO2 and nitrogen. Functional Ecology, 32(7), 1784–1796. doi: 10.1111/1365-2435.13106. Mu JP, Peng YH, Xi XQ, Wu XW, Li GY, Niklas KJ, Sun SC. 2015. Artificial asymmetric warming reduces nectar yield in a Xizang alpine species of Asteraceae. Annals of Botany, 116(6), 899–906. doi: 10.1093/aob/mcv042. Perillo GME, Wolanski E, Cahoon D, Brinson M. 2009. Coastal Wetlands: An Integrated Ecosystem Approach. Elsevier, Amsterdam, 941. Pinthus MJ. 1974. Lodging in wheat, barley, and oats: The phenomenon, its causes, and preventive measures. Advances in Agronomy, 25, 209–263. doi: 10.1016/S0065-2113(08)60782-8. Pospišilová J, Mohr H, Schopfer P. 1996. Plant physiology. Biologia Plantarum, 38, 458. doi: 10.1007/BF02896680. Rätsep M, Muru R, Freiberg A. 2018. High temperature limit of photosynthetic excitons. Nature Communications, 9(1), 99. doi: 10.1038/s41467-017-02544-7. Romero-Olivares AL, Allison SD, Treseder KK. 2017. Soil microbes and their response to experimental warming over time: A meta-analysis of field studies. Soil Biology and Biochemistry, 107, 32–40. doi: 10.1016/j.soilbio.2016.12.026. Rouse WR, Carlson DW, Weick EJ. 1992. Impacts of summer warming on the energy and water balance of wetland tundra. Climatic Change, 22(4), 305–326. doi: 10.1007/BF00142431. Rustad LE, Campbell JL, Marion GM, Norby RJ, Mitchell MJ, Hartley AE, Cornelissen JHC, Gurevitch J, GCTE-NEWS. 2001. A meta-analysis of the response of soil respiration, net nitrogen mineralization, and aboveground plant growth to experimental ecosystem warming. Oecologia, 126(4), 543–562. doi: 10.1007/s004420000544. Sánchez E, Scordia D, Lino G, Arias C, Cosentino SL, Nogués S, Lee DK, Shinners K, Finnan J, Tyner W. 2015. Salinity and water stress effects on biomass production in different Arundo donax L. clones. Bioenergy Research, 8(4), 1461–1479. doi: 10.1007/s12155-015-9652-8. Shi B, Ma JY, Wang KY, Gong JN, Zhang C, Liu WH. 2010. Effects of atmospheric elevated temperature on the growth, reproduction and biomass allocation of reclamation Phragmites australis in east beach of Chongming Island. Resources and Environment in the Yangtze Basin, 19(4), 383–388 (in Chinese with English abstract). Stefano RD, Cappetta E, Guida G, Mistretta C, Caruso G, Giorio P, Albrizio R, Tucci M. 2017. Screening of giant reed (Arundo donax L) ecotypes for biomass production under salt stress. Plant Biosystems, 152(5), 1–7. doi: 10.1080/11263504.2017.1362059. Sun SQ, Peng L, Wang GX, Wu YH, Zhou J, Bing HJ, Yu D, Luo J. 2013. An improved open-top chamber warming system for global change research. Silva Fennica, 47(2), 250–254. doi: 10.14214/sf.960. Suseela V, Conant RT, Wallenstein MD, Dukes JS. 2015. Effects of soil moisture on the temperature sensitivity of heterotrophic respiration vary seasonally in an old-field climate change experiment. Global Change Biology, 18(1), 336–348. doi: 10.1111/j.1365-2486.2011.02516.x. Wang JF, Wu QB. 2013. Impact of experimental warming on soil temperature and moisture of the shallow active layer of wet meadows on the Qinghai-Xizang Plateau. Cold Regions Science and Technology, 90–91. doi: 10.1016/j.coldregions.2013.03.005. Warwick NWM, Brock MA. 2003. Plant reproduction in temporary wetlands: The effects of seasonal timing, depth, and duration of flooding. Aquatic Botany, 77(2), 153–167. doi: 10.1016/S0304-3770(03)00102-5. Wookey PA, Parsons AN, Welker JM, Potter JA, Callaghan TV, Lee JA. 1993. Comparative responses of phenology and reproductive development to simulated environmental change in sub-arctic and high arctic plants. Oikos, 67(3), 490–502. doi: 10.2307/3545361. Wu W, Ma BL. 2018. Assessment of canola crop lodging under elevated temperatures for adaptation to climate change. Agricultural and Forest Meteorology, 248, 329–338. doi: 10.1016/j.agrformet.2017.09.017. Xu YY, Ramanathan V. 2012. Latitudinally asymmetric response of global surface temperature: Implications for regional climate change. Geophysical Research Letters, 39(13), 13706. doi: 10.1029/2012GL052116. Ye SY, Krauss KW, Brix H, Wei MJ, Olsson L, Yu XY, Ma XY, Wang J, Yuan HM, Zhao GM. 2016. Inter-annual variability of area-scaled gaseous carbon emissions from wetland soils in the Liaohe Delta, China. PLoS ONE, 11(8), e0160612. doi: 10.1371/journal.pone.0160612. Yu JB, Li YZ, Han GX, Zhou D, Fu YQ, Guan B, Wang GM, Ning K, Wu HF, Wang JH. 2014. The spatial distribution characteristics of soil salinity in coastal zone of the Yellow River Delta. Environmental Earth Sciences, 72(2), 589–599. doi: 10.1007/s12665-013-2980-0. Yu XY, Ye SY. 2020. The universal applicability of logistic curve in simulating ecosystem carbon dynamic. China Geology, 3(2), 292–298. doi: 10.31035/cg2020029. Zhang ZS, Xue ZS, Lu XG, Jiang M, Mao DH, Huo LL. 2017. Warming in spring and summer lessens carbon accumulation over the past century in temperate wetlands of Northeast China. Wetlands, 37(5), 829–836. doi: 10.1007/s13157-017-0915-3. Zhou YM, Hagedorn F, Zhou CL, Jiang XJ, Wang XX, Li MH. 2016. Experimental warming of a mountain tundra increases soil CO2 effluxes and enhances CH4 and N2O uptake at Changbai Mountain, China. Scientific Reports, 6(1), 21108. doi: 10.1038/srep21108. Zhu JT, Zhang YJ, Jiang L. 2017. Experimental warming drives a seasonal shift of ecosystem carbon exchange in Xizang alpine meadow. Agricultural and Forest Meteorology, 233, 242–249. doi: 10.1016/j.agrformet.2016.12.005. -
Access History

-
Figure 1.
Location (a) of the warming experiment and open-top chamber (OTC) chamber setup (b, c).
-
Figure 2.
Visualization of plant biomass (g fresh weight) estimation equation. The red dots indicate the measured 25 shoots of local Phragmites, and the integrated blue surface indicates the fitting equation for estimating plant fresh biomass.
-
Figure 3.
Daily averaged environmental variables associated with OTCs and control plots in the Yellow River Delta. a‒red line represents the air temperature and the blue bars indicate precipitation; b‒orange line represents the daily averaged net radiation and the grey bars represent the wind speed; c‒water table relative to the soil surface during the observing period.
-
Figure 4.
Diel variation of air temperature and soil temperature on typical sunny days. Temperatures in OTCs are colored red and the temperatures in the control plots are colored black. For the air temperature graphs, the upper level (190 cm) temperatures were drawn with solid lines while the lower level (100 cm) temperatures were drawn with dashed lines. Soil temperatures of depth 5 cm, 10 cm, 20 cm, and 30 cm are marked with circles, squares, triangles, and crosses, respectively. Three typical days of full sunlight were selected including 18 June, 3 August, and 27 September, indicating late spring, summer, and autumn patterns.
-
Figure 5.
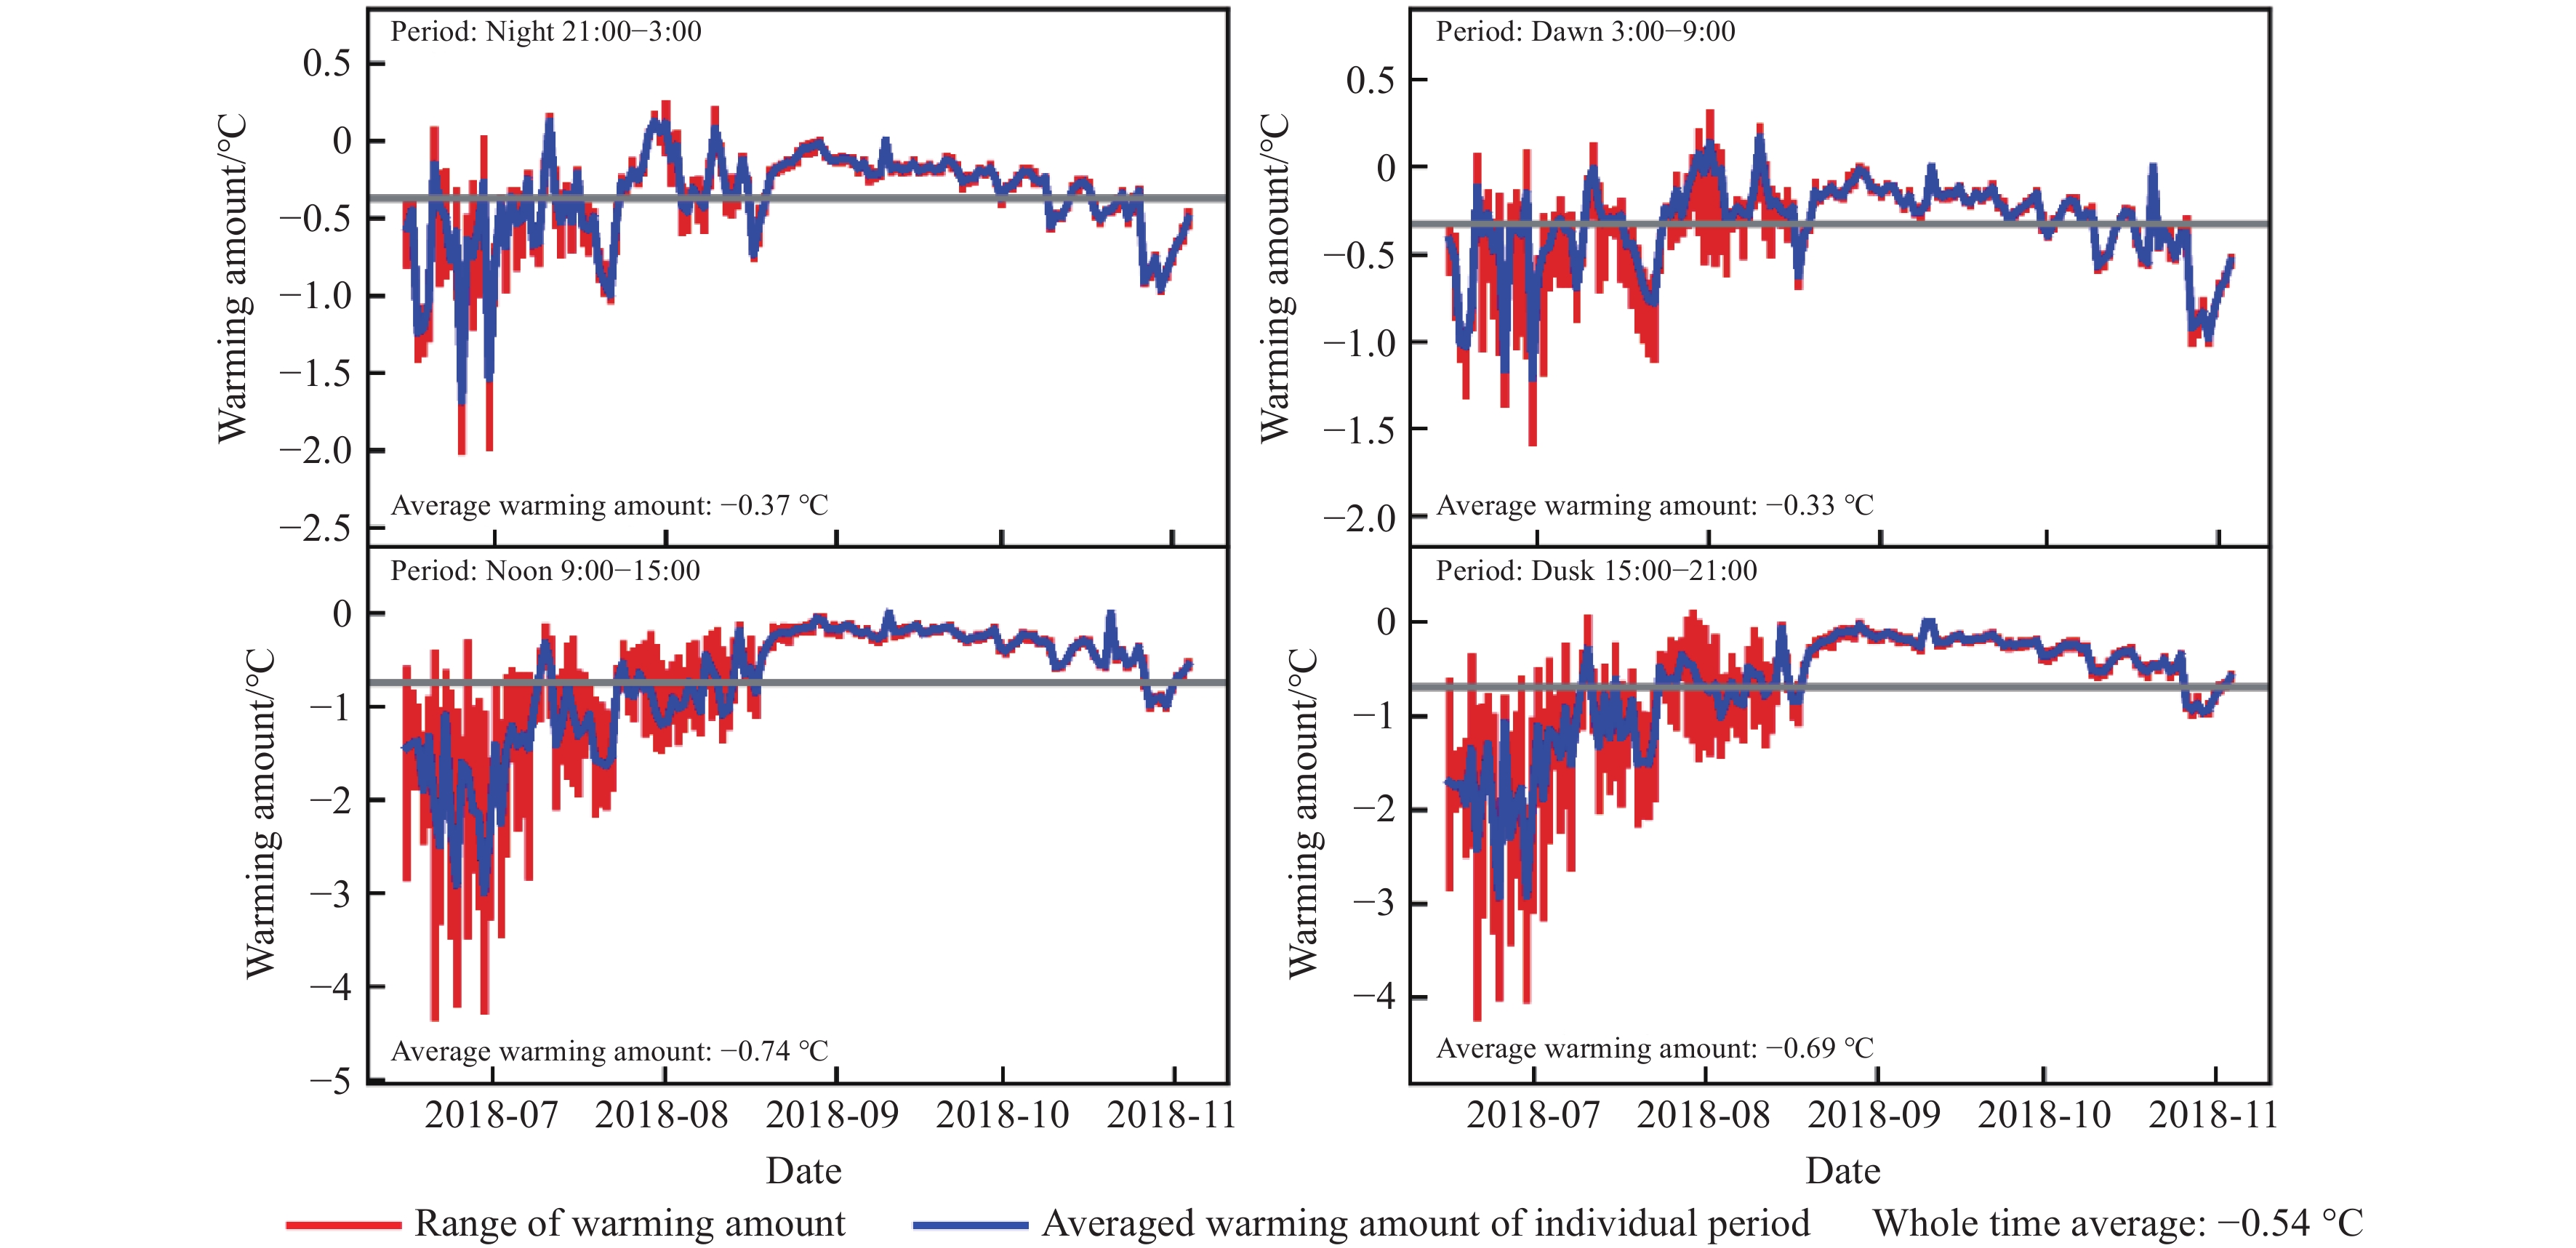
OTCs warming amount of air temperatures over four diel periods. Periods were determined as night (21:00 to 3:00), morning (3:00 to 9:00), noon (9:00 to 15:00) and dawn (15:00 to 21:00). The red bars represent the warming amount range for a single day during a corresponding period. The blue lines represent the average warming amount of the corresponding period.
-
Figure 6.
Diel variation of air temperature and soil temperature on typical cloudy/rainy days. Temperatures in OTCs are colored red and the temperatures in the control plot are colored black. For the air temperature graphs, the upper level (190 cm) temperatures were drawn with solid lines while the lower level (100 cm) temperatures were drawn with dashed lines. Soil temperatures of depth 5 cm, 10 cm, 20 cm, and 30 cm are marked with circles, squares, triangles, and crosses, respectively. Three typical days of cloudy/rainy were chosen as 22 June, 19 August, and 9 October, indicating late spring, summer, and autumn patterns.
-
Figure 7.
OTCs warming amount of 5 cm depth soil temperatures over four diel periods. Periods were determined as night (21:00 to 3:00), morning (3:00 to 9:00), noon (9:00 to 15:00) and dawn (15:00 to 21:00). The red bars represent the warming amount range for a single day during a corresponding period. The blue lines represent the average warming amount of the corresponding period.
-
Figure 8.
Influence of OTCs warming on soil water content and soil conductivity at different soil depths. The blue bars indicate the traits of the control plots and the red bars indicate the traits of OTCs warming conditions. Bars represent standard deviations of the mean within each group to highlight the variability (vs. standard error). The horizontal red lines indicated no significant difference within each group.
-
Figure 9.
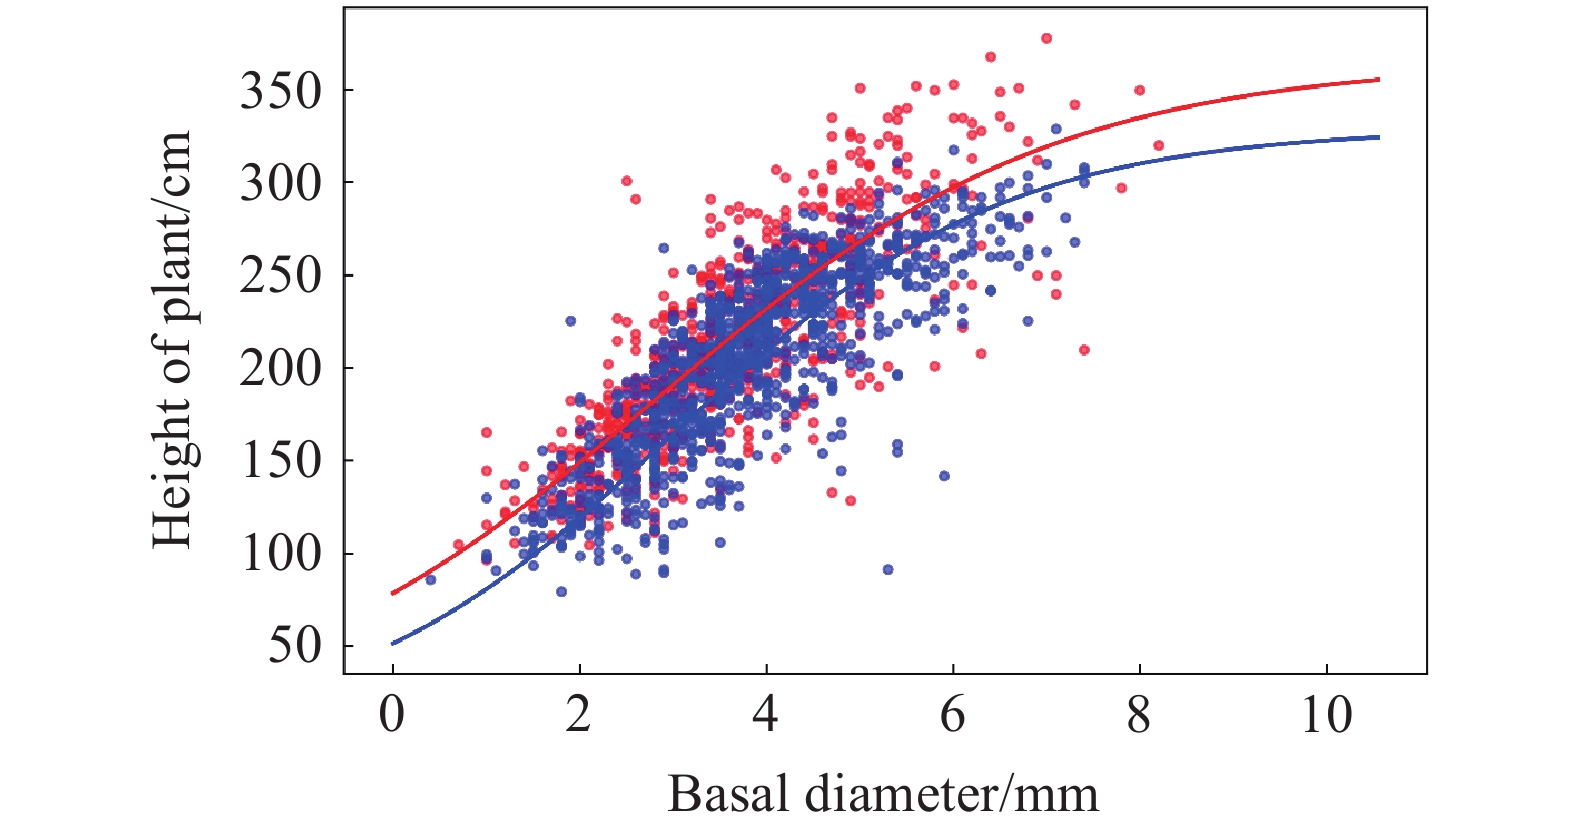
Separated groups of the relationship between stem basal diameter and plant height. The red lines and symbols indicate plant traits inside the OTCs while the blue lines and symbols represent plant traits outside the OTCs (control). Lines represent least squares fitting, with a sigmoidal curve representing the best fit among those tested.
-
Figure 10.
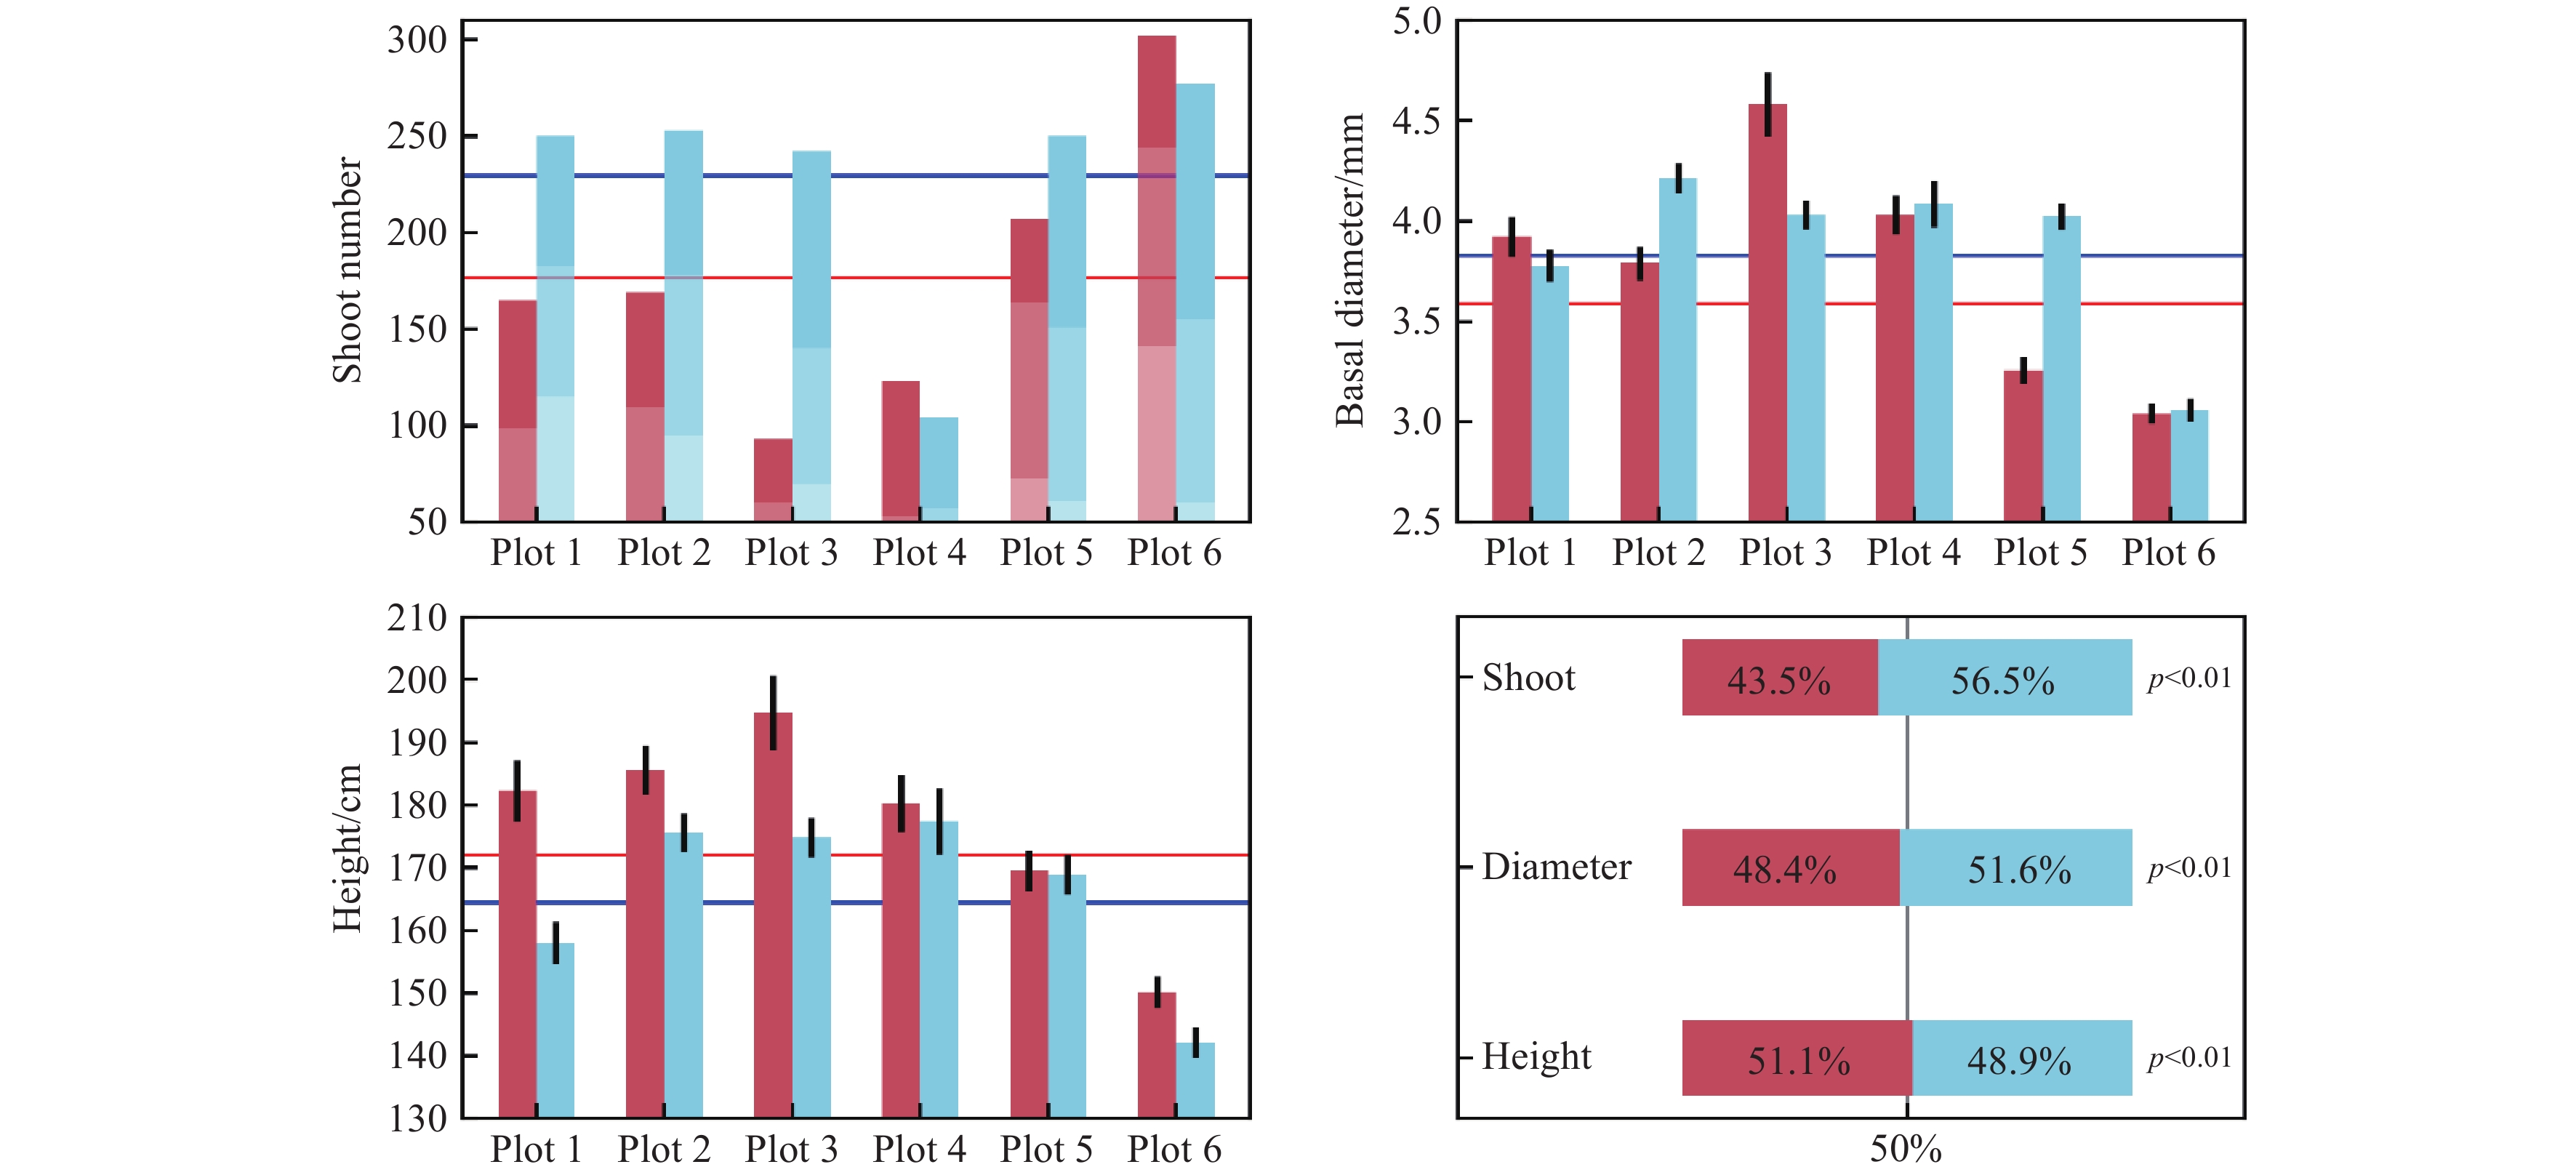
Influence of OTCs warming on Phragmites’ height and basal stem diameter. The color red represents OTCs warming conditions and the color blue represents non-warmed control plots. The stacked bars of the upper left pane indicate three selected quadrats. Bars represent standard errors of the mean.
-
Figure 11.
Visual comparison of Phragmites inside and outside the OTCs. Common reeds grew normally and erect in control plots (a, c); whereas, lodging and aphid attacks occurred in the OTCs (b, d).
-
Figure 12.
Relationship between air temperature daily warming amount and its influencing factors of net radiation and wind speed.
-
Figure 13.
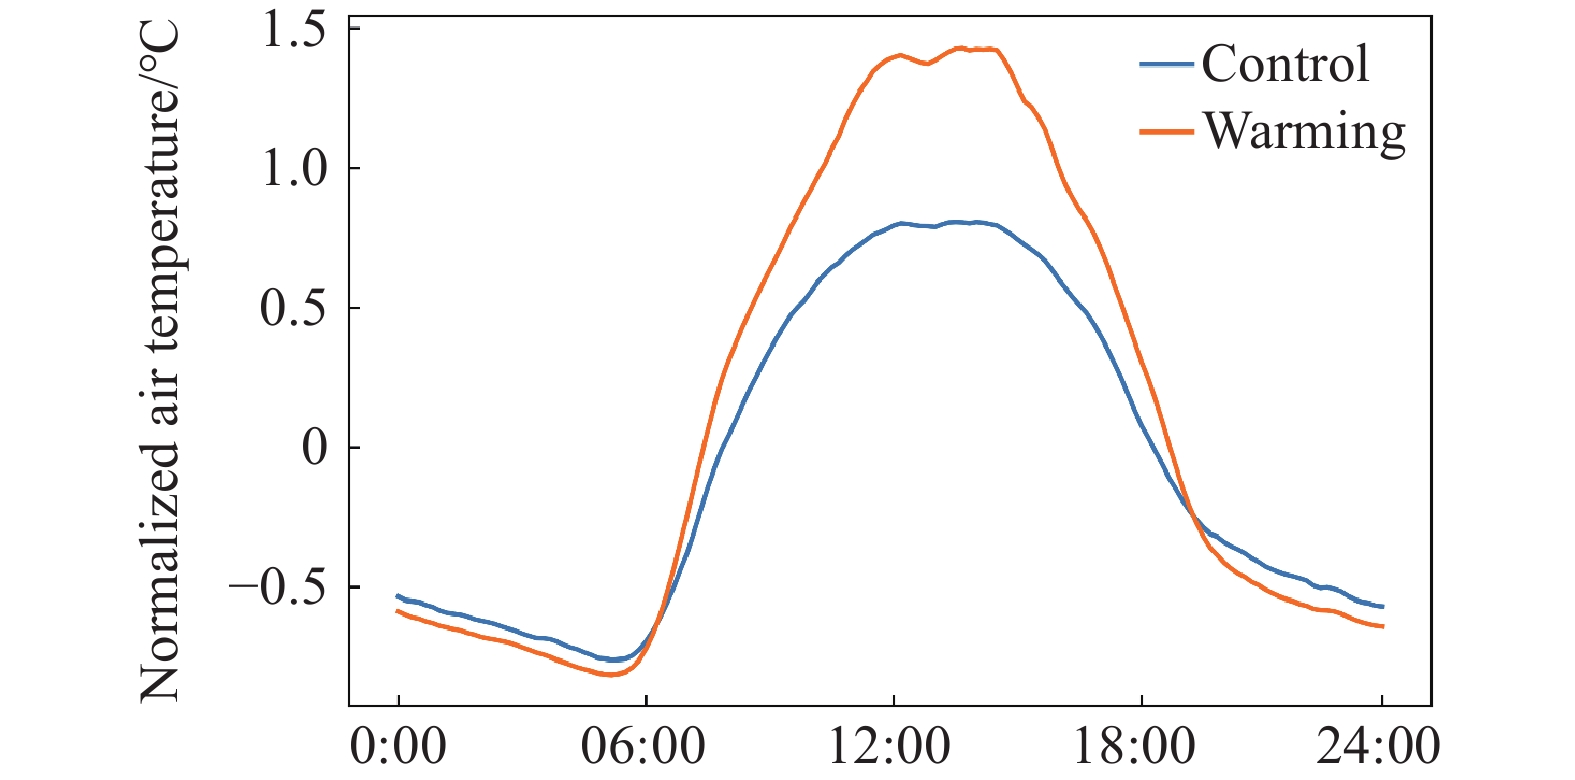
Normalized air temperature inside and outside the OTCs. Within each observing day, the daily air temperature was linearly normalized by regulating the daily lowest air temperature as −1, the daily highest air temperature as 1, and the daily average air temperature as 0. All observed air temperature data from 14 June to 4 November were used.
-
Figure 14.
Environmental factors contributing to OTCs’ night-time cooling processes. In the upper panels, the black line represents the air temperature difference between the high position (190 cm) versus the low position (100 cm) inside OTCs. The red solid and dashed lines represent the warming amount of the high position and low position, respectively. The net radiation (NR) is represented by orange solid lines. In the lower panels, grey and black color indicate soil temperature responses at the soil depths of 5 cm and 30 cm, respectively, while the solid and dashed lines indicate the warming and control conditions, respectively. The relative humidity (RH) of inside OTCs air was marked as blue solid lines.
-
Figure 15.
Schematic explanation of OTCs warming as surmised from these experiments. The color bar demonstrates the relative temperature, and the orange arrows indicate the heat flow. Wind and turbulence were marked as blue arrows.



 DownLoad:


