Tian-wen Liu, Cheng Hu, Qing Wang, Jun Li, Kun Huang, Zhi-hua Chen, Ting-ting Shi, 2020. Conversion relationship of rainfall-soil moisture-groundwater in Quaternary thick cohesive soil in Jianghan Plain, Hubei Province, China, China Geology, 3, 462-472. doi: 10.31035/cg2020053
Citation: Tian-wen Liu, Cheng Hu, Qing Wang, Jun Li, Kun Huang, Zhi-hua Chen, Ting-ting Shi, 2020. Conversion relationship of rainfall-soil moisture-groundwater in Quaternary thick cohesive soil in Jianghan Plain, Hubei Province, China, China Geology, 3, 462-472. doi: 10.31035/cg2020053

Conversion relationship of rainfall-soil moisture-groundwater in Quaternary thick cohesive soil in Jianghan Plain, Hubei Province, China

More Information
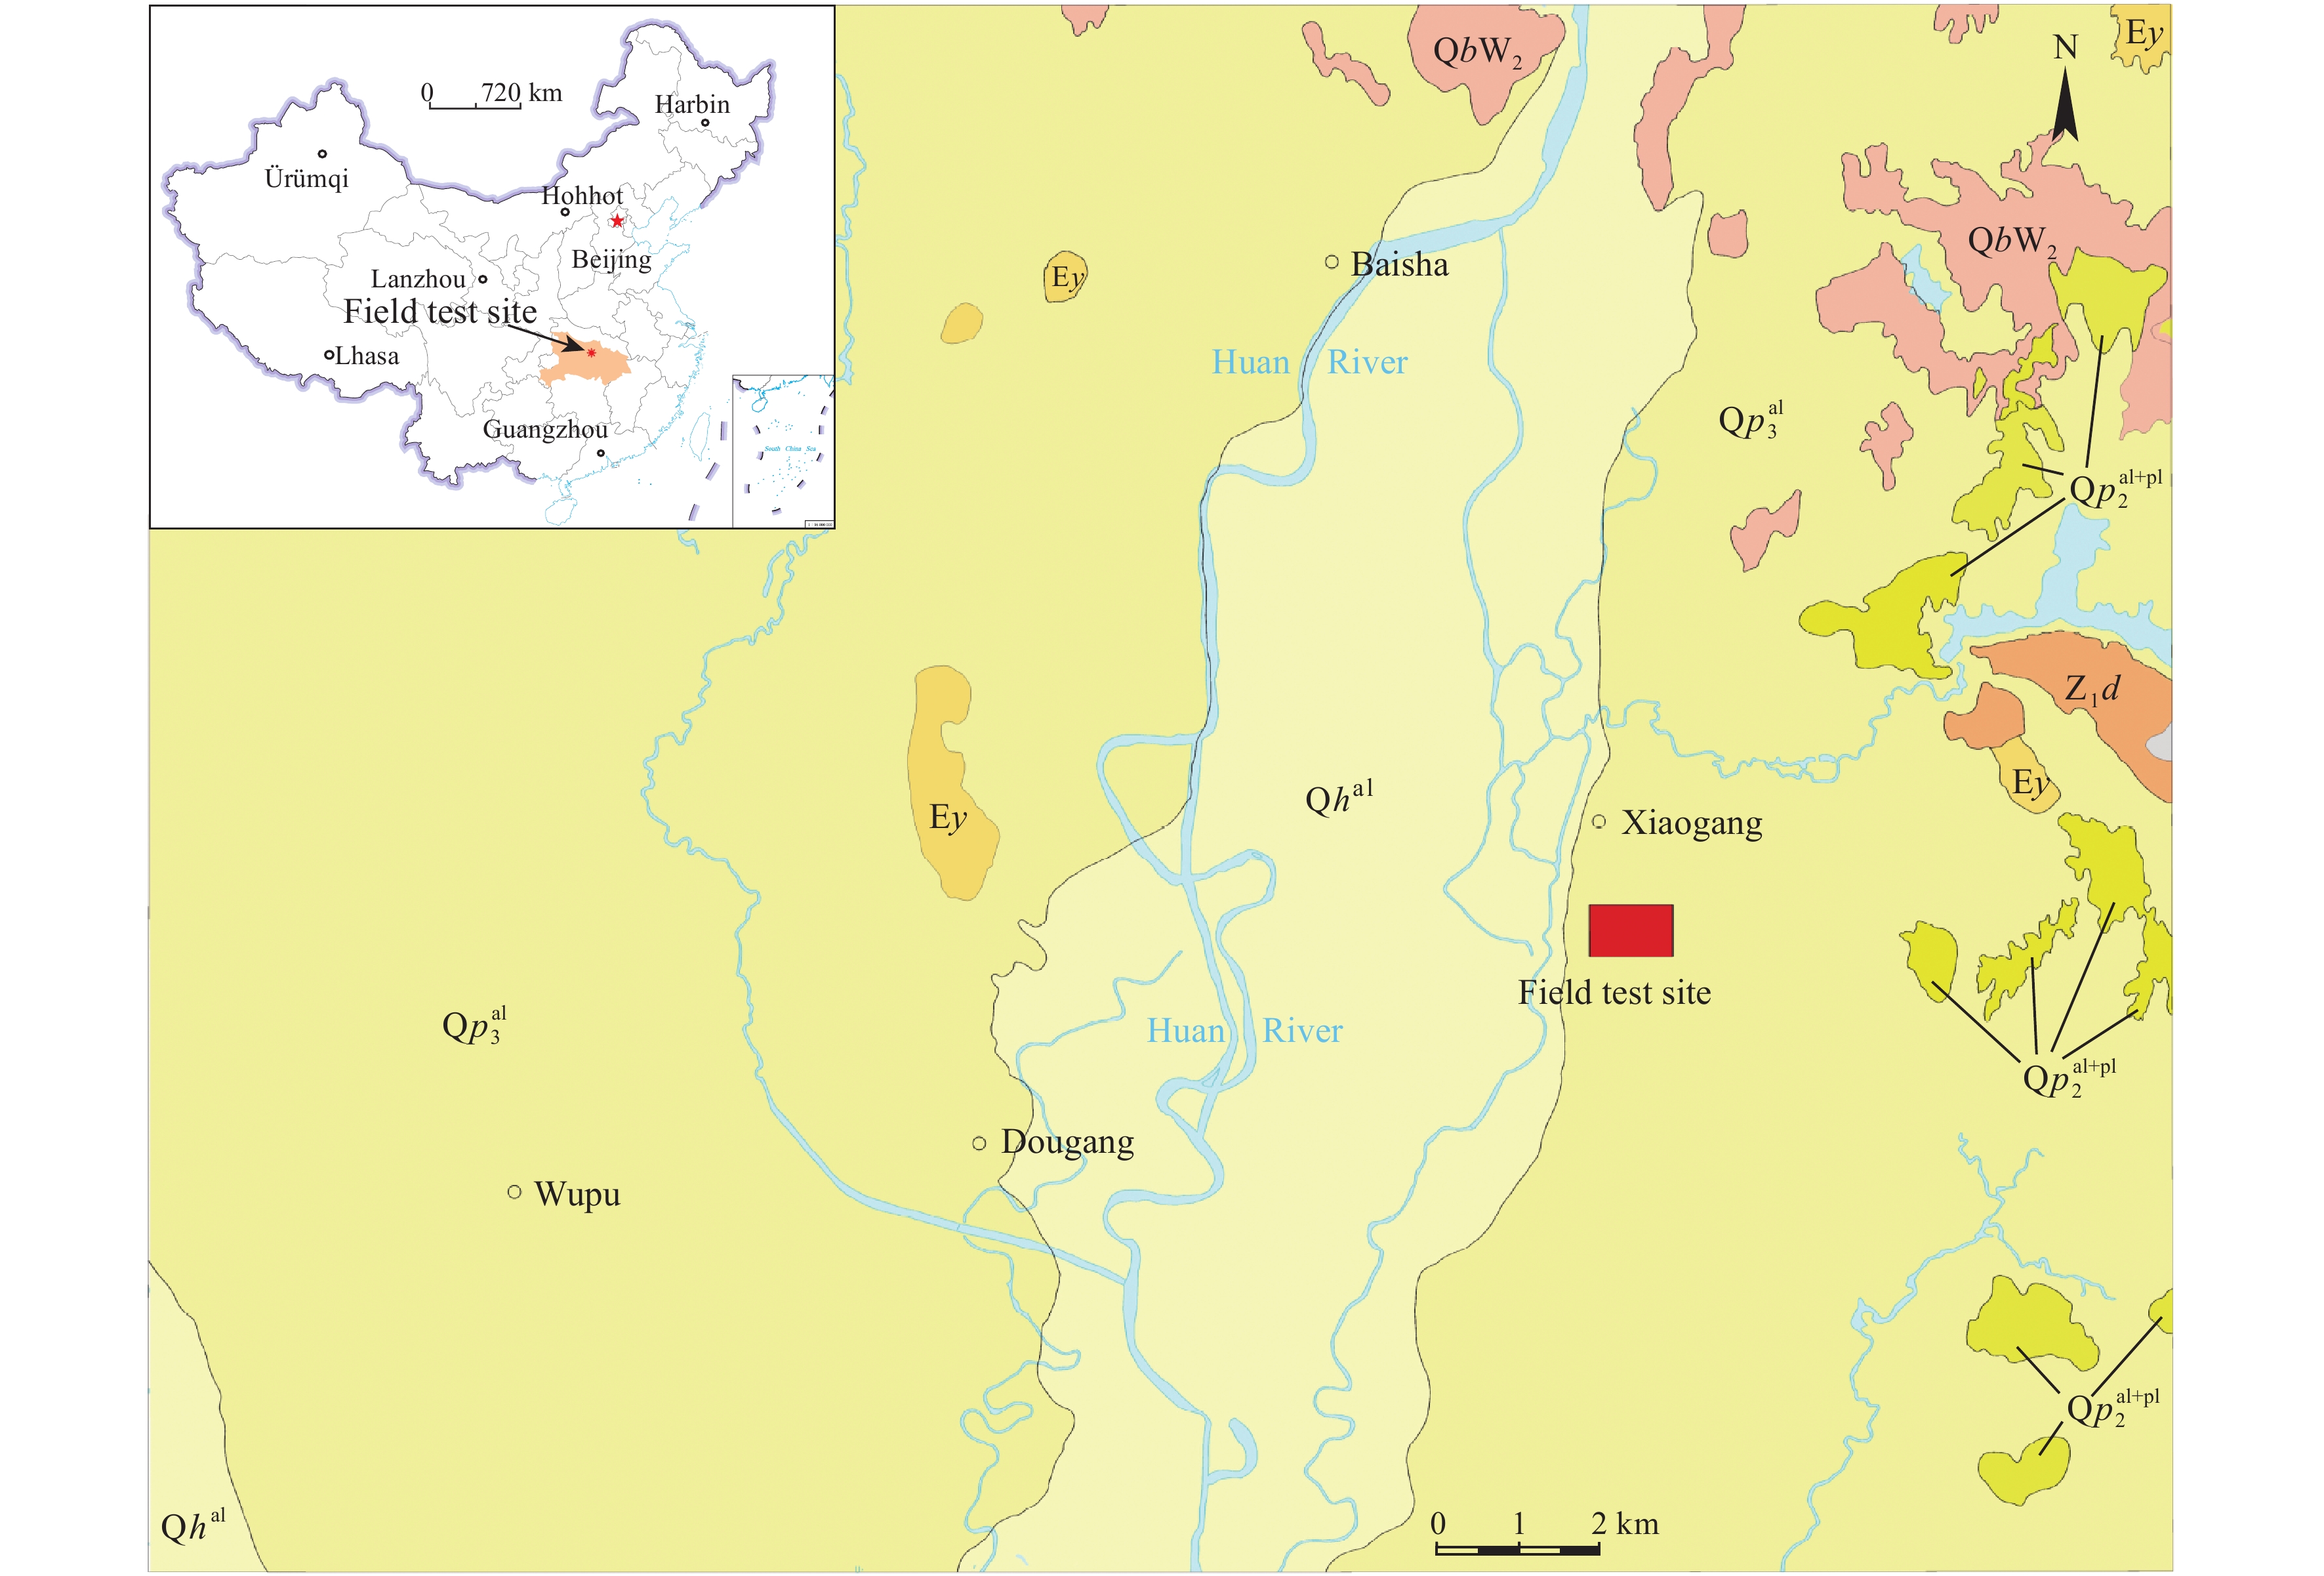
  • The scientific field test site of rainfall-soil moisture-groundwater conversion in Dabie Mountain Area–Jianghan Plain is located in the northern region of the Jianghan Plain, the transition zone between the Dabie Mountain Area and Jianghan Plain. It’s a great field test site to study the material and energy exchange among rainfall, soil moisture, and groundwater of the Earth’s critical zone in subtropical monsoon climate plain areas. This paper analyzed the connection between rainfall and volume water content (VWC) of soil at different depths of several soil profiles, and the dynamic feature of groundwater was discussed, which reveals the rainfall infiltration recharge of Quaternary Upper Pleistocene strata. The results show that the Quaternary Upper Pleistocene aquifer groundwater accepts a little direct rainfall recharge, while the lateral recharge is the main supplement source. There were 75 effective rainfall events among 120 rainfall events during the monitoring period, with an accumulated amount of 672.9 mm, and the percentages of effective rainfall amount and duration time were 62.50% and 91.56%, respectively. The max evaporation depth at the upper part in Quaternary cohesive soil was no less than 1.4 m. The soil profile was divided into four zones: (1) The sensitive zone of rainfall infiltration within 1.4 m, where the material and energy exchange frequently near the interface between atmosphere and soil; (2) the buffer zone of rainfall infiltration between 1.4 m and 3.5 m; (3) the migration zone of rainfall infiltration between 3.5 m and 5.0 m; and (4) the rainfall infiltration and groundwater level co-influenced zone below 5.0 m. The results revealed the reaction of soil moisture and groundwater to rainfall in the area covered by cohesive soil under humid climate in Earth’s critical zone, which is of great theoretical and practical significance for groundwater resources evaluation and development, groundwater environmental protection, ecological environmental improvement, drought disaster prevention, and flood disaster prevention in subtropical monsoon climate plain areas.

  • The Earth’s critical zone extends through the pedosphere, unsaturated vadose zone, and saturated groundwater zone (National Research Council, 2001), including the land surface and its canopy of vegetation, rivers, lakes, and shallow seas. The critical zone’s environment sustains nearly all terrestrial life, and it is regarded as the top one of six basic research opportunities in Earth Science (National Research Council, 2001; Li JQ et al., 2019; Zhang GL et al., 2019).

    The Dabie Mountain Area is one of the 14 contiguous destitute areas in China; it is not only an important ecological functional area but also the ecological security barrier in the middle and lower reaches of the Yangtze River. The Jianghan Plain is located in the south-central part of Hubei Province, and most of its groundwater resources are stored in Quaternary aquifers. With the rapid development of industry and agriculture in Jianghan Plain in recent years, the groundwater has been gradually over-exploited and polluted by domestic garbage (Liu LC et al., 2009; Chen W et al., 2017), industrial waste (Zhao J et al., 2019), fertilizers and pesticides (Zhao DJ et al., 2007; Meng SH et al., 2011; Deng QJ et al., 2014; Yang J et al., 2018).

    In recent years, the research on soil moisture transport at domestic and overseas mainly focus on sand, loam, clay loam, and loess in arid or semi-arid areas, covering different fields (Xiao DA and Wang SJ, 2009; Zhang JX et al., 2017; He MN et al., 2017) such as farmland irrigation, environmental water conservancy, hydrogeology (Lin D et al., 2014; Sun FQ et al., 2017; Pang ZH et al., 2018), and agricultural water-saving irrigation (Zhu HY et al., 2014). However, there is little research on water transport in cohesive soils in humid climate areas. Some progress was made on hydrogeological characteristics of the study area (Fig. 1) in the previous hydrogeological investigation. By analyzing the rainfall and groundwater dynamic of different aquifers, Chang W et al. (2019) and Liu XR et al. (2019) pointed out that the Quaternary Upper Pleistocene (Qp3al) shallow confined aquifer in the eastern side of the Huan River mainly accepts the rainfall infiltration recharge in front of the eastern mountain and the lateral runoff recharge of Wudang Group (QbW2) weathered fissure water. Then the shallow confined groundwater flows through the unconfined pore water aquifer in the form of horizontal runoff and finally drains into the Huan River. Hu MY et al. (2018) found that the Quaternary Upper Pleistocene (Qp3al) shallow confined groundwater has multiple recharge sources and the maximum variation of δD and δ18O among different aquifers in the study area based on hydrogen and oxygen isotope data of rainfall, surface water, and groundwater.

    Figure 1.  Regional geological sketch map and the location of the field test site. The symbols in the figure are shown in Table 1.
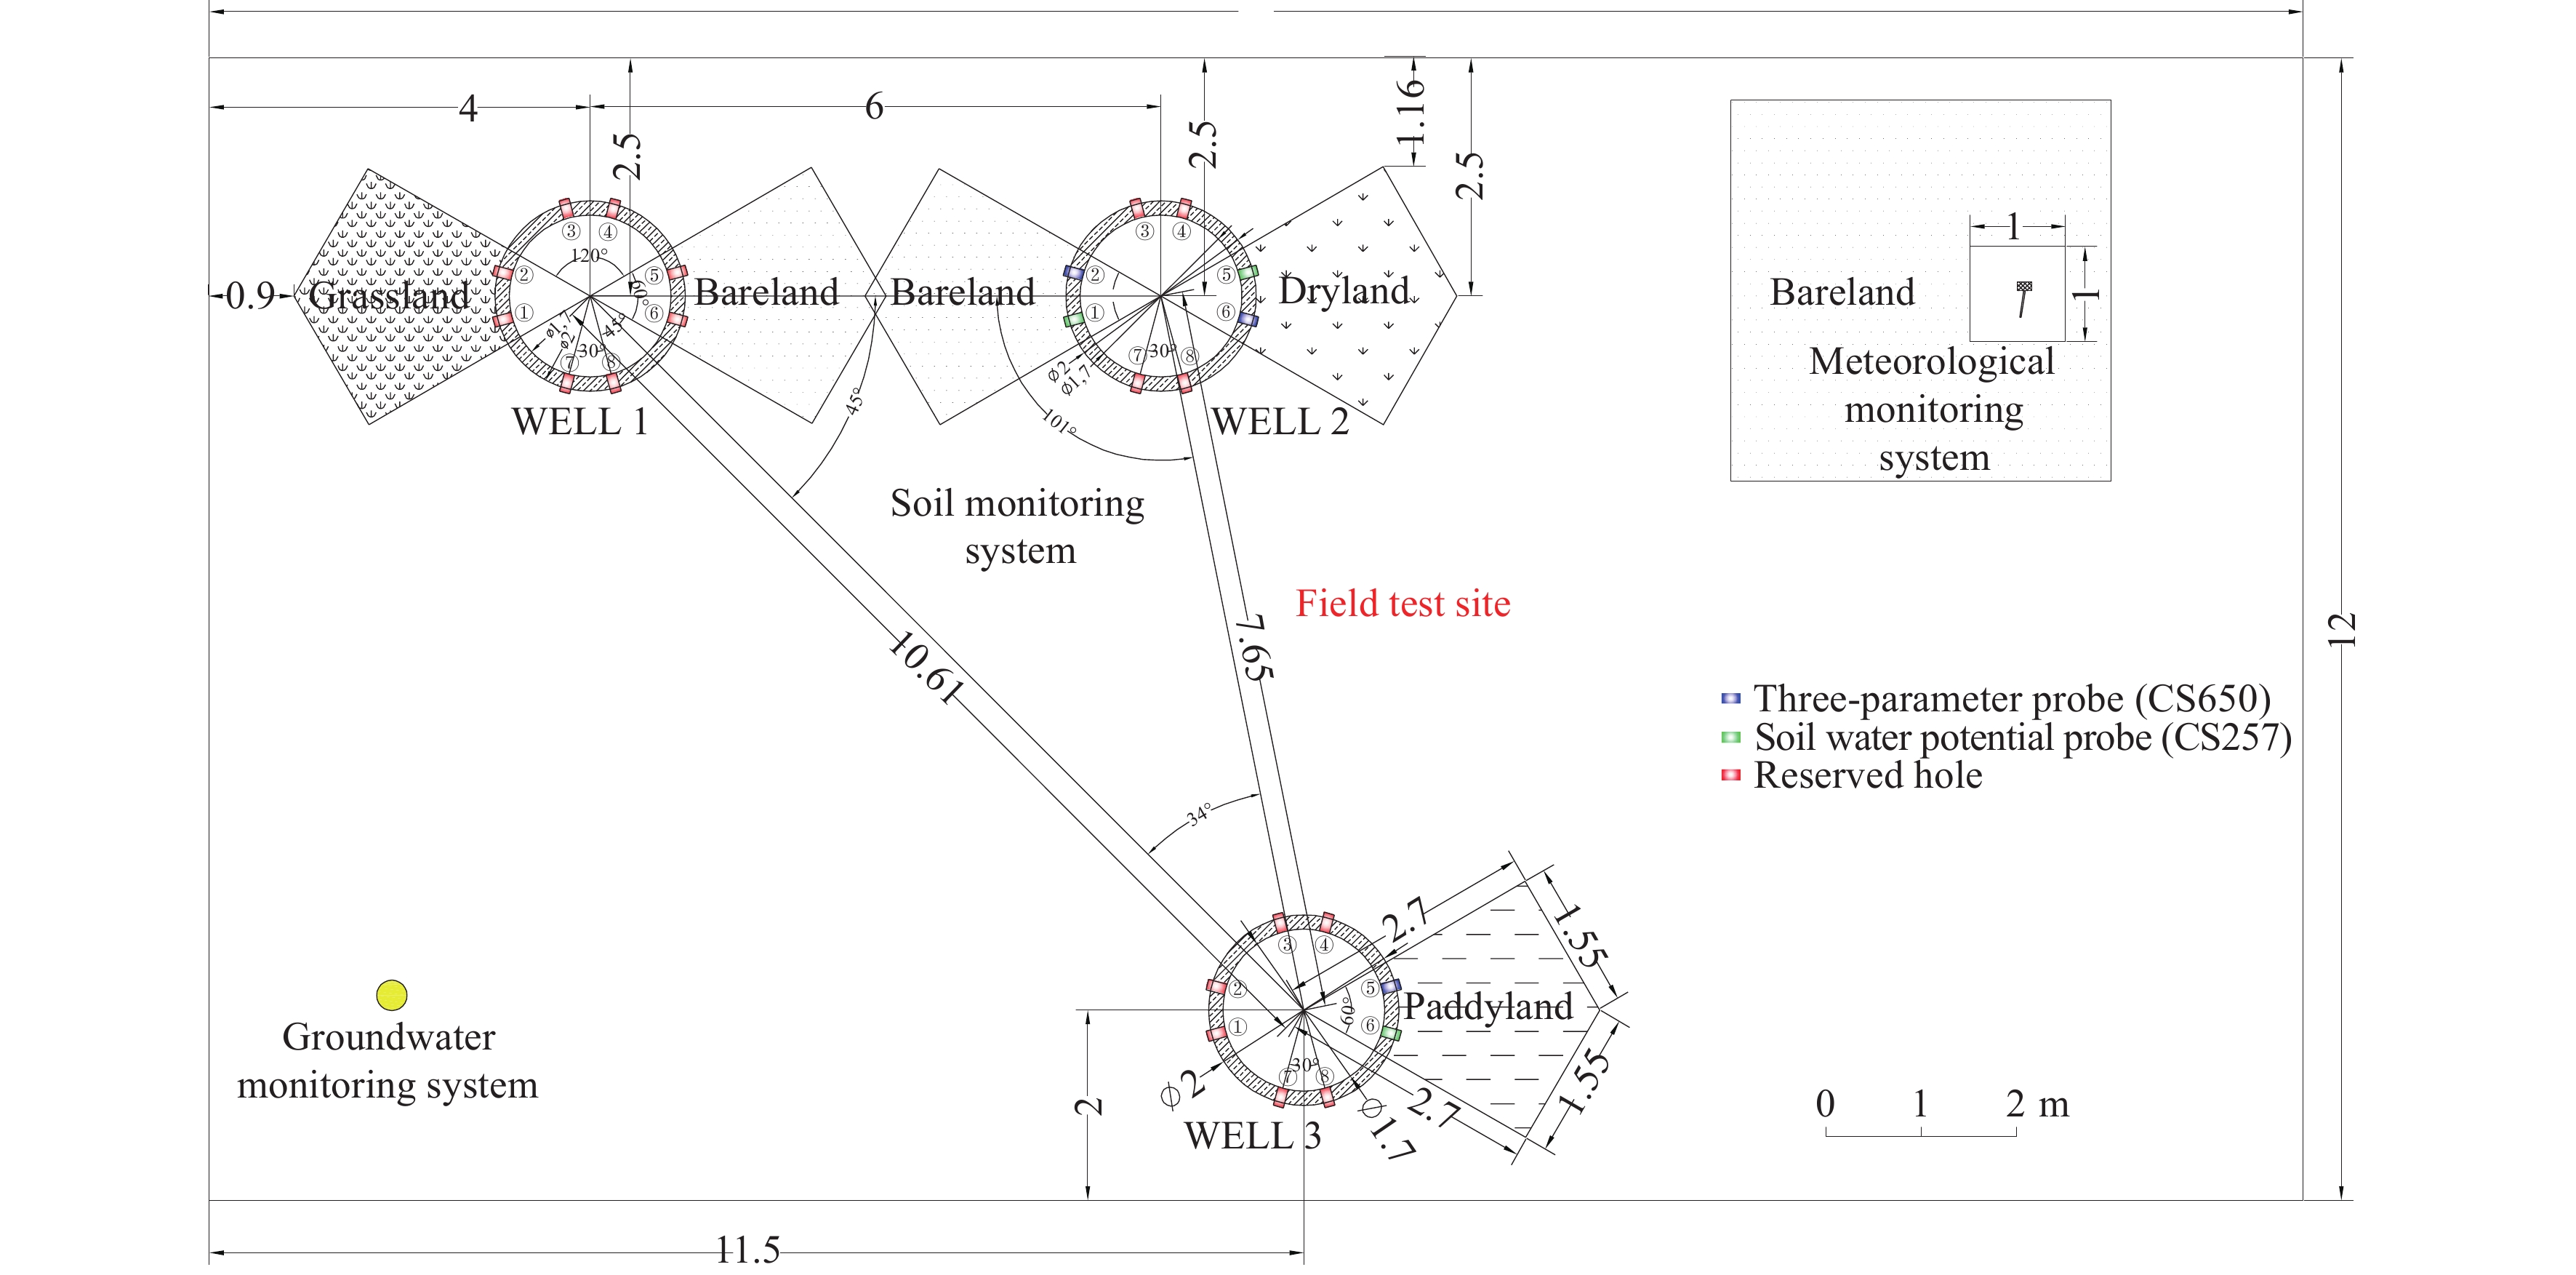
    Based on the current progress of a regional hydrogeological survey project by the Wuhan Center of Geological Survey, China Geological Survey (CGS) in Xiaogan City, the authors built a field test site named “Dabie Mountain Area–Jianghan Plain rainfall, soil moisture, and groundwater conversion scientific field test site” in 2018 to make further study of (1) the rainfall infiltration recharge of Quaternary Upper Pleistocene shallow confined aquifers covered by thick cohesive soil; (2) groundwater supply in plain areas; and (3) the sources, way, and process of pore groundwater pollution. This research will contribute a lot to regional groundwater environmental protection, ecological environmental improvement, drought disaster prevention, and flood disaster prevention; which provides strong theory and method support for the Yangtze River great protection strategy.

    Xiaogan City has a subtropical monsoon climate and is located in the northern region of the Jianghan Plain, China, with an average annual temperature between 15.5 °C and 16.5 °C. The annual average rainfall of Xiaogan in recent decades is about 1152 mm, and 70% of the rainfall is mainly concentrated from May to August.

    The Quaternary Upper Pleistocene (Qp3al) stratum is most widely distributed in the study area, followed by the Quaternary Holocene (Qhal) stratum. The stratum widely covered after Quaternary is the Yuntaiguan Formation (Ey) of Paleogene. Wudang Group (QbW2) is the oldest stratum in the region, which is exposed only in the northeast corner on the bottom of the study area (Fig. 1; Table 1).

    Table 1.  Table of the regional chronostratigraphy in the Jianghan Plain.
    ErathemSystemSeriesGroup/Formation/BedSymbolType and description of rock
    Cenozoic(Kz)Quaternary(Q)Holocene(Qh)QhalThe upper part is silty clay, sandy silt; the top part is medium sand with gravel; the bottom part is sandy gravel
    Pleistocene(Qp)Qp3alThe upper part is clay and silty clay with a different color; the bottom part is the sand-gravel layer
    Qp2al+plThe upper part is the sand-gravel layer; the top part is the net-like clay; the bottom part is sand-gravel layer with net-like clay
    Paleogene(E)YuntaiguanEyFuchsia sandstone, gravelly sandstone, sandy conglomerate
    Neoproterozoic
    (Pt3)
    Ediacaran/Sinian
    (Z/Sn)
    DoushantuoZ1dBlack siliceous rock
    Mesoproterozoic
    (Pt2)
    WudangQbW2Biotite-albit schist
     | Show Table
    DownLoad: CSV

    The sand-gravel layer in the bottom part of the Quaternary Upper Pleistocene stratum has good water yield property and plenty of water. As the main domestic water for local residents, the quality and quantity of the water stored in this aquifer are very important to the residents’ lives. Because of a 10 m thick or even thicker layer of cohesive soil covering the area, whether the rainfall can vertically get through the thick cohesive soil to a shallow confined aquifer becomes a key issue for groundwater resource evaluation.

    To find out the recharge mode of the Quaternary Upper Pleistocene stratum with thick cohesive soil in Jianghan Plain, the authors built a field test site in Xiaogang Town, Xiaogan City, Hubei Province, China (Fig. 1).

    The ground elevation of the field test site is 33.40 m. The initial stable groundwater level is 25.72 m. According to the drilling data (Liu TW et al., 2020) (Table 2), the geological structure can be divided into three parts from top to bottom: The top part is 13.00 m thick cohesive soil, the middle part is 2.00 m thick gray-black muddy sand, and the bottom part is 3.00 m thick sand gravel. It’s an ideal test site for rainfall-soil moisture-groundwater conversion research.

    Table 2.  Geological structure information of the field test site.
    Stratum symbolDepth/mElevation/
    m
    Main lithologyHydraulic conductivity (K)/(cm/s)Permeability
    Qp3al0–0.233.20Cultivated soil10–7–10–5Extremely low-weak
    0.2–12.5521.85Silty loam
    12.55–13.021.40Silty clay
    13.0–15.018.40Gray-black muddy sand\\
    15.0–18.015.40Sand-gravel1.3×10–2strong
     | Show Table
    DownLoad: CSV

    The establishment of the field test site aimed at studying the influence of thick cohesive soil to rainfall infiltration recharge of groundwater. Based on learning from previous studies (Yang JF et al., 1999; Xiao DA and Wang SJ, 2009; Chen SN et al., 2010; Cremer CJM et al., 2016; Zhang JX et al., 2017; He MN et al., 2017; Xu YD et al., 2018; Liu FF et al., 2020) of soil moisture, the authors determined the monitoring elements of the test site by introducing Time Domain Reflectometry (TDR) (Zhao Y et al., 2016) technology, stable hydrogen and oxygen isotopes (Gazis C and Feng XH, 2004; Li FD et al., 2007; Song XF et al., 2009; Ma B et al., 2017; Sprenger M et al., 2017; Brewer PE et al., 2018; Brinkmann N et al., 2018; Che CW et al., 2019; Huang H et al., 2019), element geochemistry (Zhao J et al., 2019; Huo SY et al., 2020; Qian Z et al., 2020), organic chemistry (Wang XJ et al., 2006; Yuan RQ et al., 2012; Zhang CX et al., 2013; Kafaei R et al., 2020), heat flux (Haverd V et al., 2007; Ren R et al., 2017; Gomez I et al., 2018; Shao W et al., 2018; Wan HL et al., 2020;) et cetera into this research.

    As is shown in Fig. 2 (the ground conditions were all bare land during the monitoring period), the field test site consists of three monitoring systems: The meteorological monitoring system, the soil moisture monitoring system, and the groundwater monitoring system. The monitoring factors of the field test site mainly included air temperature, humidity, rainfall, evaporation, volume water content (VWC), soil water potential, soil temperature, soil salinity, groundwater level, groundwater temperature, and groundwater conductivity (Table 3).

    Figure 2.  The schematic plan of the field test site.
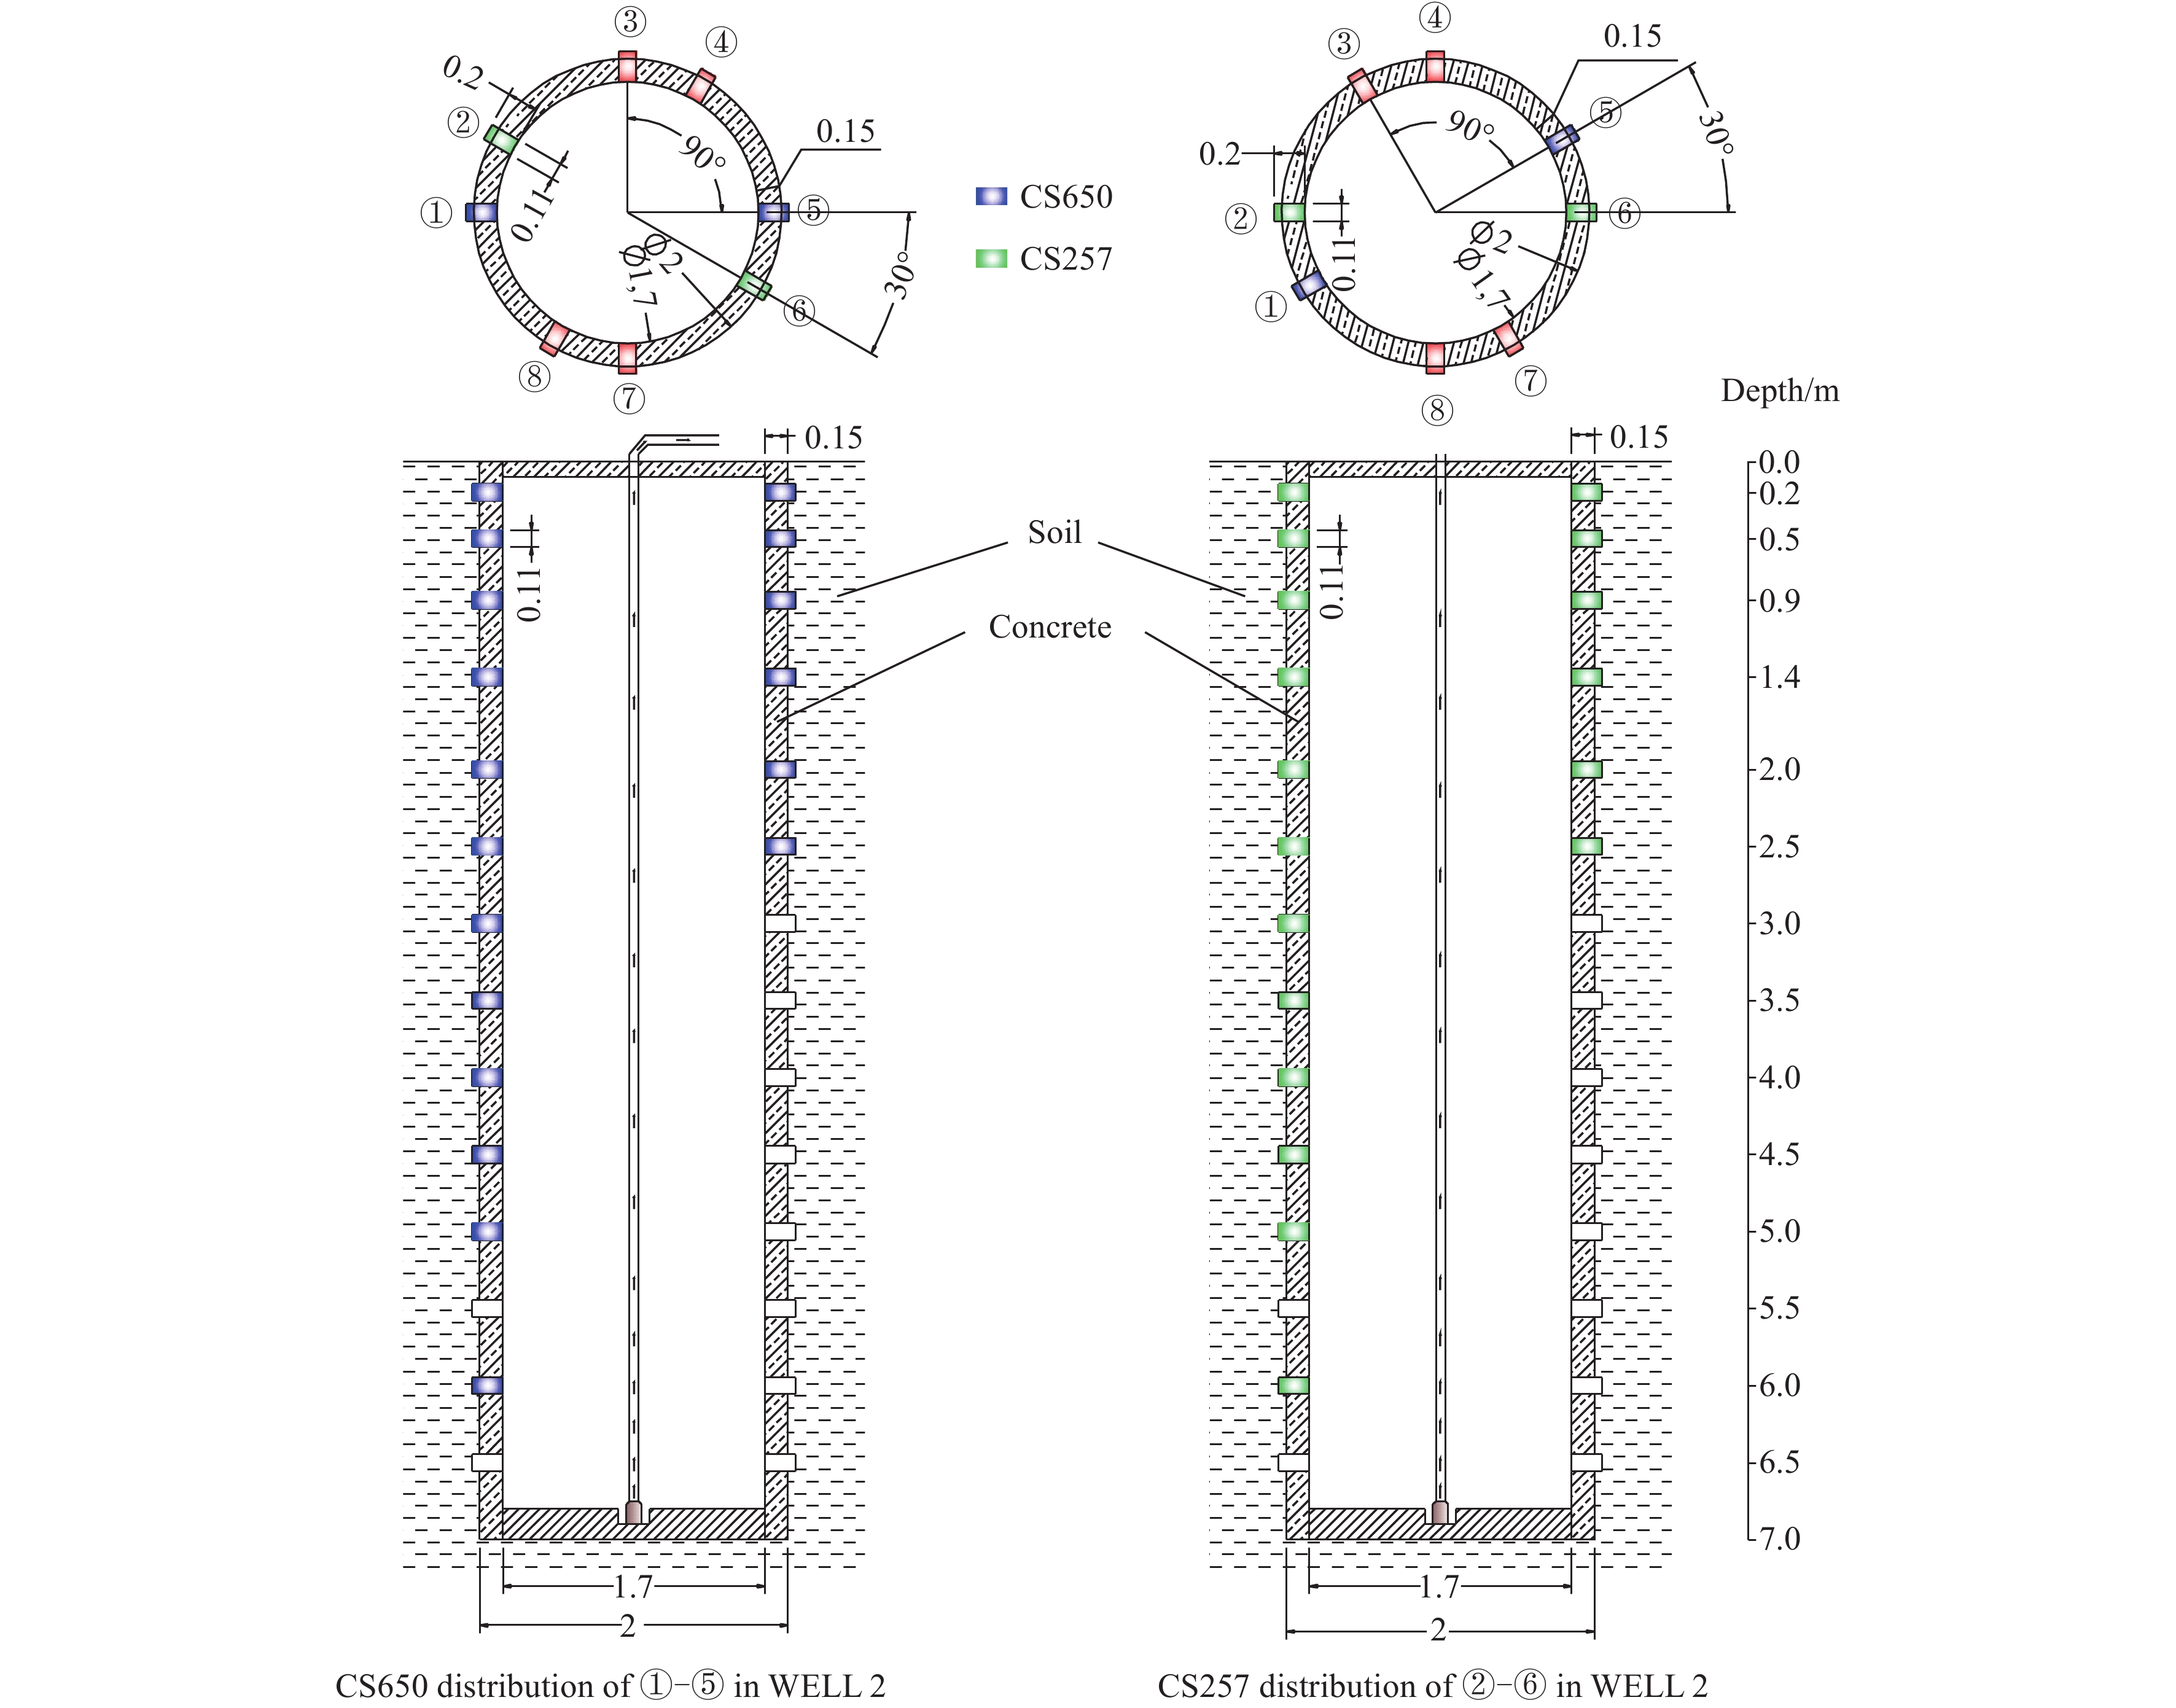
    Table 3.  Monitoring systems and factors.
    ObjectFactorMonitoring typeMonitoring system
    SoilVolume water content (VWC), soil electrical conductivity, soil water potential, soil temperature, surface heat fluxAutoSoil moisture monitoring system
    Soil moisture hydrochemistry, stable hydrogen and oxygen isotopes, heavy metal pollutants, pesticide pollutantsManual
    AtmosphereRainfall, evaporation, air temperature, humidity, wind speed, wind direction, atmospheric pressure, net solar radiation, photosynthetically active radiationAutoMeteorological monitoring system
    GroundwaterLevel, temperature, electrical conductivityGroundwater monitoring system
    Hydrochemistry, stable hydrogen and oxygen isotopes, pesticide pollutantsManual
     | Show Table
    DownLoad: CSV

    This system is aimed at studying the transport of soil moisture, solute, and heat in the unsaturated zone above the groundwater level. VWC, soil water potential, soil temperature, and soil salinity were monitored online every 10 minutes in the soil moisture monitoring system. The monitoring factors and equipment are detailed in Table 4.

    Table 4.  Monitoring equipment and factors of the soil moisture monitoring system.
    Equipment modelFactorCompanyFrequency
    CS650Volume water content, electrical conductivity, soil temperatureCampbell, AmericaEvery 10 minutes
    CS257Soil water potential
    HFP01Surface heat flux
     | Show Table
    DownLoad: CSV

    According to the geological structure and groundwater level at the field test site, the soil moisture monitoring system included three test wells which were 7 m deep and 2 m in diameter. Each cylindrical test well consisted of four vertical set profiles in four directions (east, south, west, and north), and each vertical profile included two rows of holes going vertically.

    The three test wells were excavated manually, and a reinforced concrete round wall was built at each 0.90 m until the depth of 7.00 m. The bottom of these three test wells were also constructed of reinforced concrete. The holes of test wells were drilled horizontally by using an electric drill with a diameter of 110 mm. PVC pipe with 110 mm diameter and rotatable pipe covers were used to fit the holes to prevent water from passing through freely. In order to reduce the edge effect of soil water transport, all the probes (CS650, CS257) were buried horizontally in the soil, 0.10 m away from the concrete.

    The depths of monitoring layers should take the stratification of lithology into consideration. Being affected by rainfall and evaporation, the soil water content and the soil water potential gradient change frequently in the zone near the surface (Xiao DA and Wang SJ, 2009; Chen SY et al., 2012; Lin D et al., 2014; Zhu HY et al., 2014). Because of these two points, the distance between adjacent monitoring layers at a depth of 2.0 m should be delineated to be 0.2 m, 0.5 m, 0.9 m, 1.4 m, and 2.0 m. The distance between adjacent monitoring layers with depths between 2.0 m and 7.0 m are designed to be equal to 0.5 m, and the depths of reserved monitoring layers are 2.5 m, 3.0 m, 3.5 m, 4.0 m, 4.5m, 5.0 m, 5.5 m, 6.0 m, and 6.5 m in test wells. Each vertical profile reserved 14 side holes for probe installation, soil moisture sampling, and soil moisture testing.

    The authors have monitored the western profile named 2W in test WELL 2, eastern profile named 2E in test WELL 2 and the eastern profile named 3E in test WELL 3 since Jun. 1st, 2018 under bare land conditions. The equipment layout plan of the monitoring profile in WELL 2 and WELL 3 can be seen in Fig. 3 and Fig. 4. The equipments’ distribution in 2W profile and 3E profile are the same with the depths of 0.2 m, 0.5 m, 0.9 m, 1.4 m, 2.0 m, 2.5 m, 3.0 m, 3.5 m, 4.0 m, 4.5m, 5.0 m, and 6.0 m. The 2E profile only has six layers monitored with the depths of 0.2 m, 0.5 m, 0.9 m, 1.4 m, 2.0 m, and 2.5 m.

    Figure 3.  Equipment layout plan of monitoring profile in WELL 2.
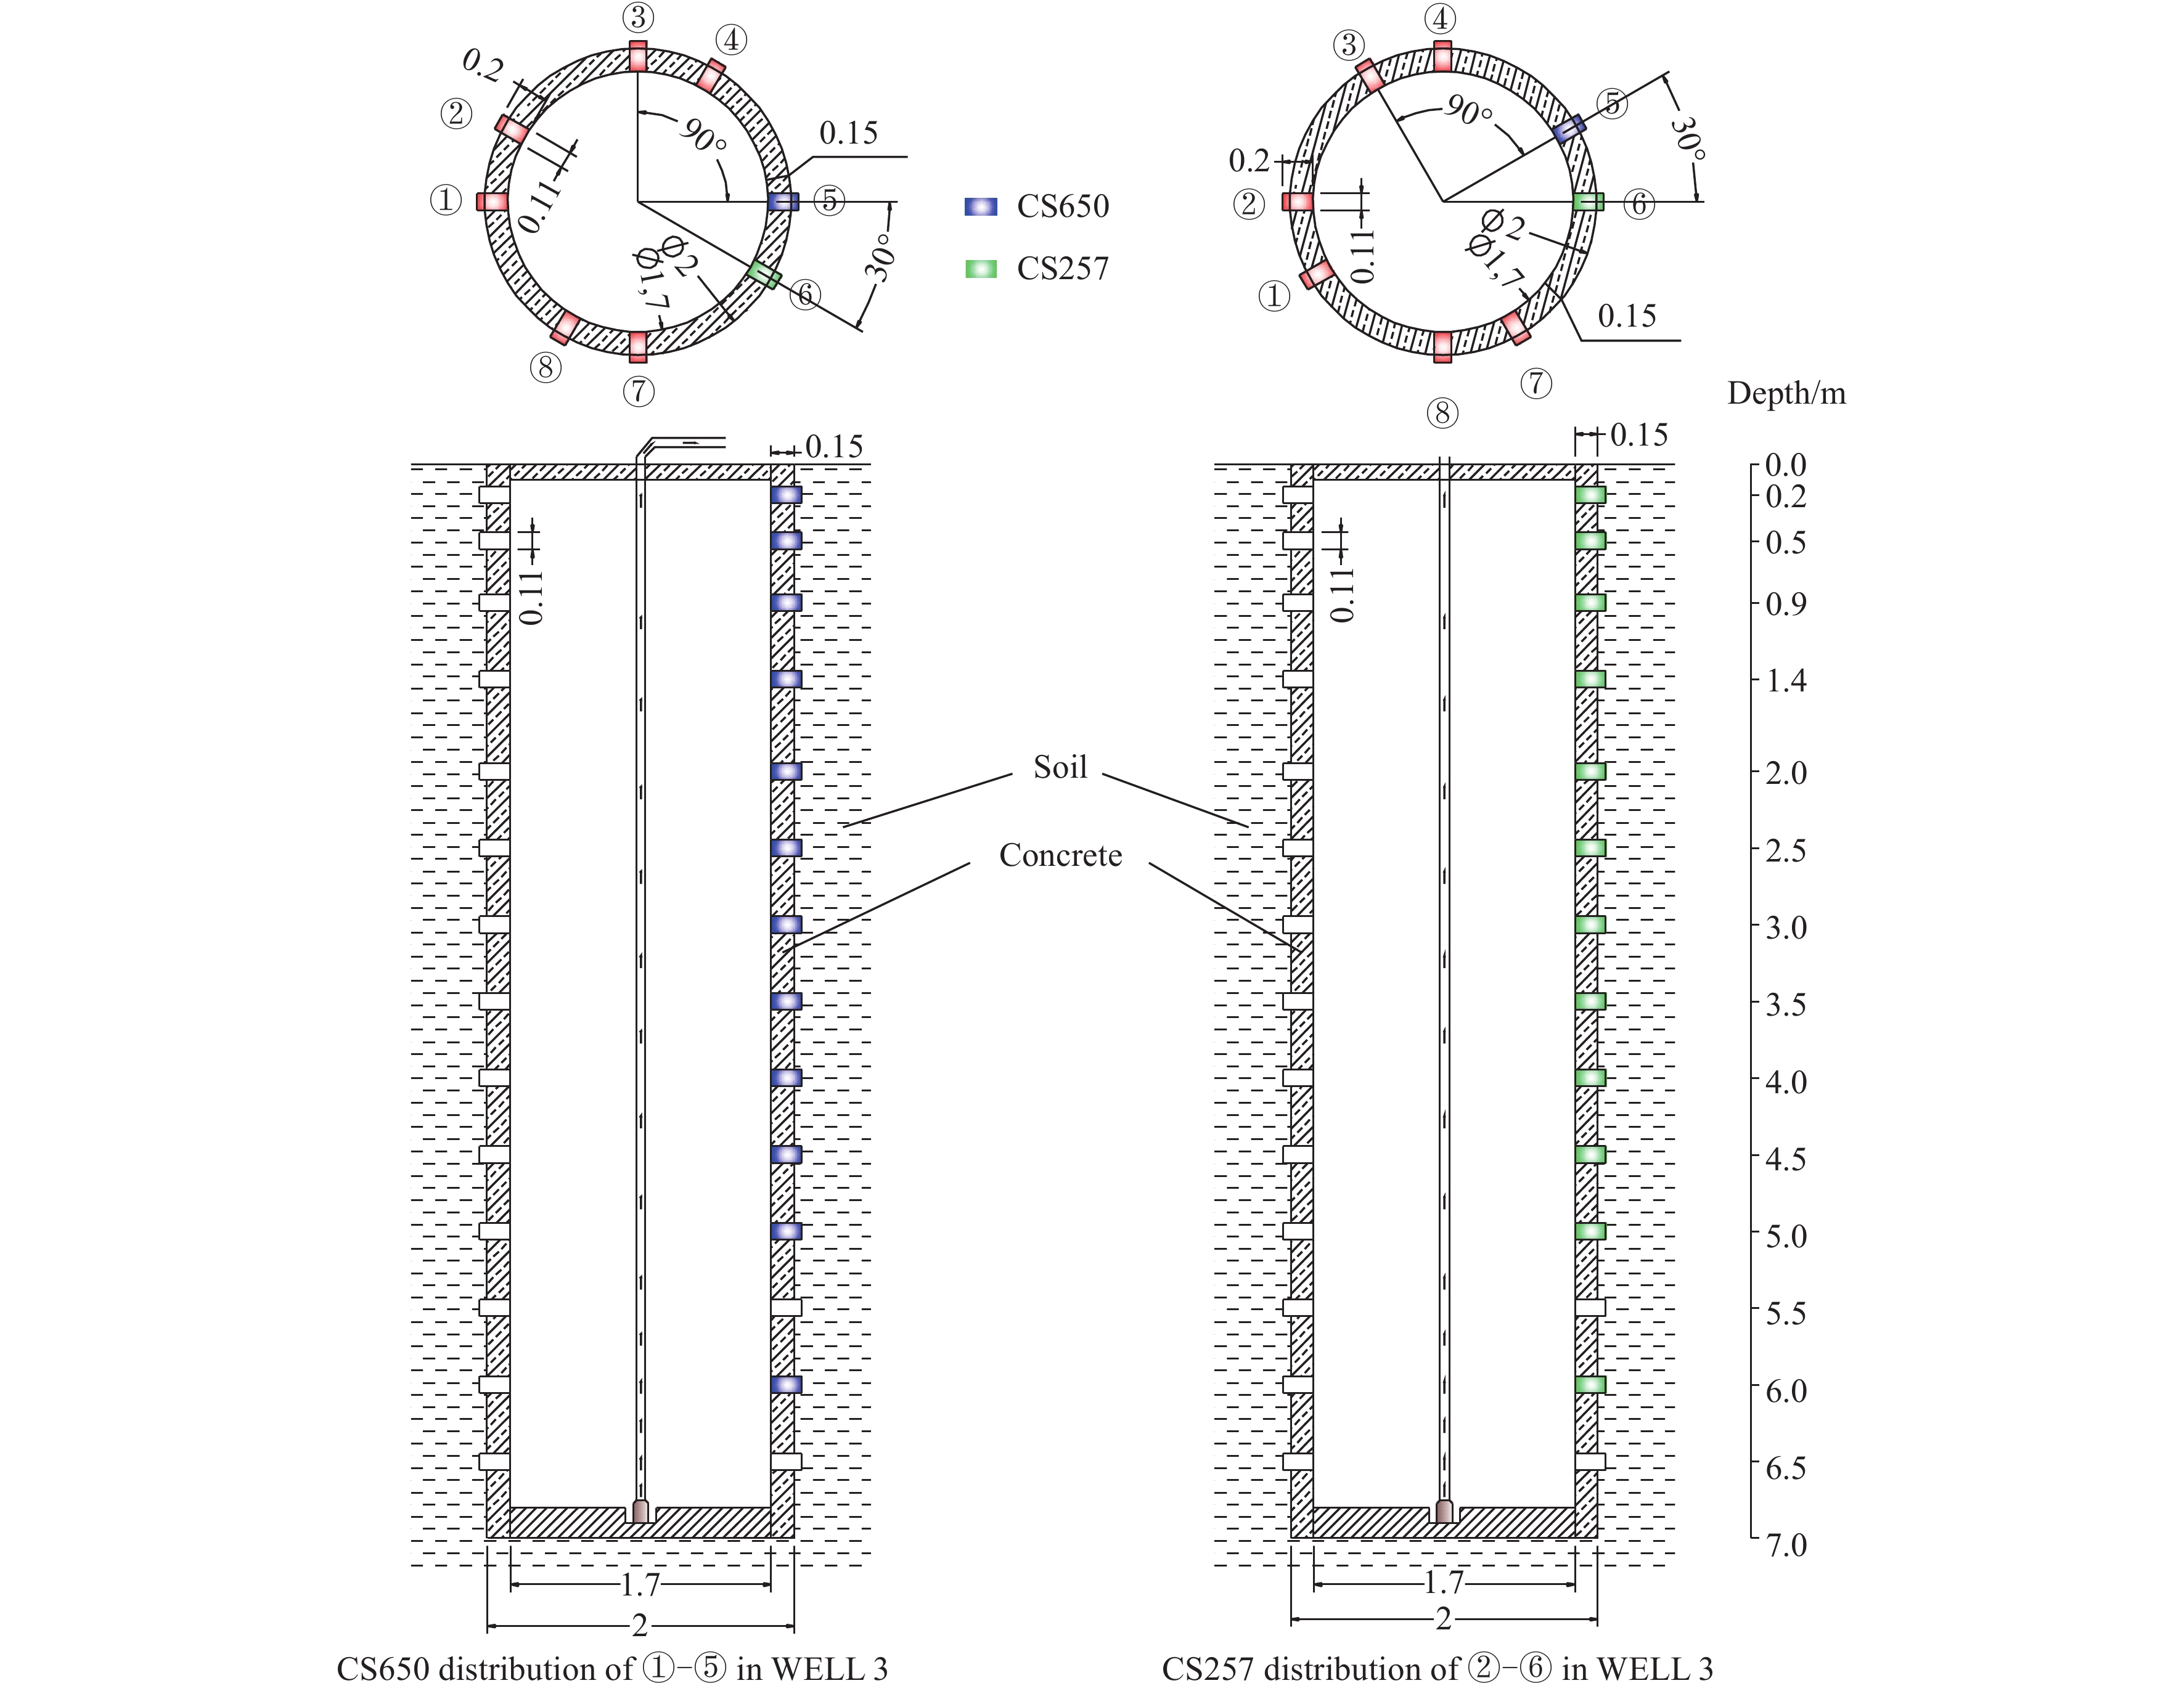
    Figure 4.  Equipment layout plan of monitoring profile in WELL 3.
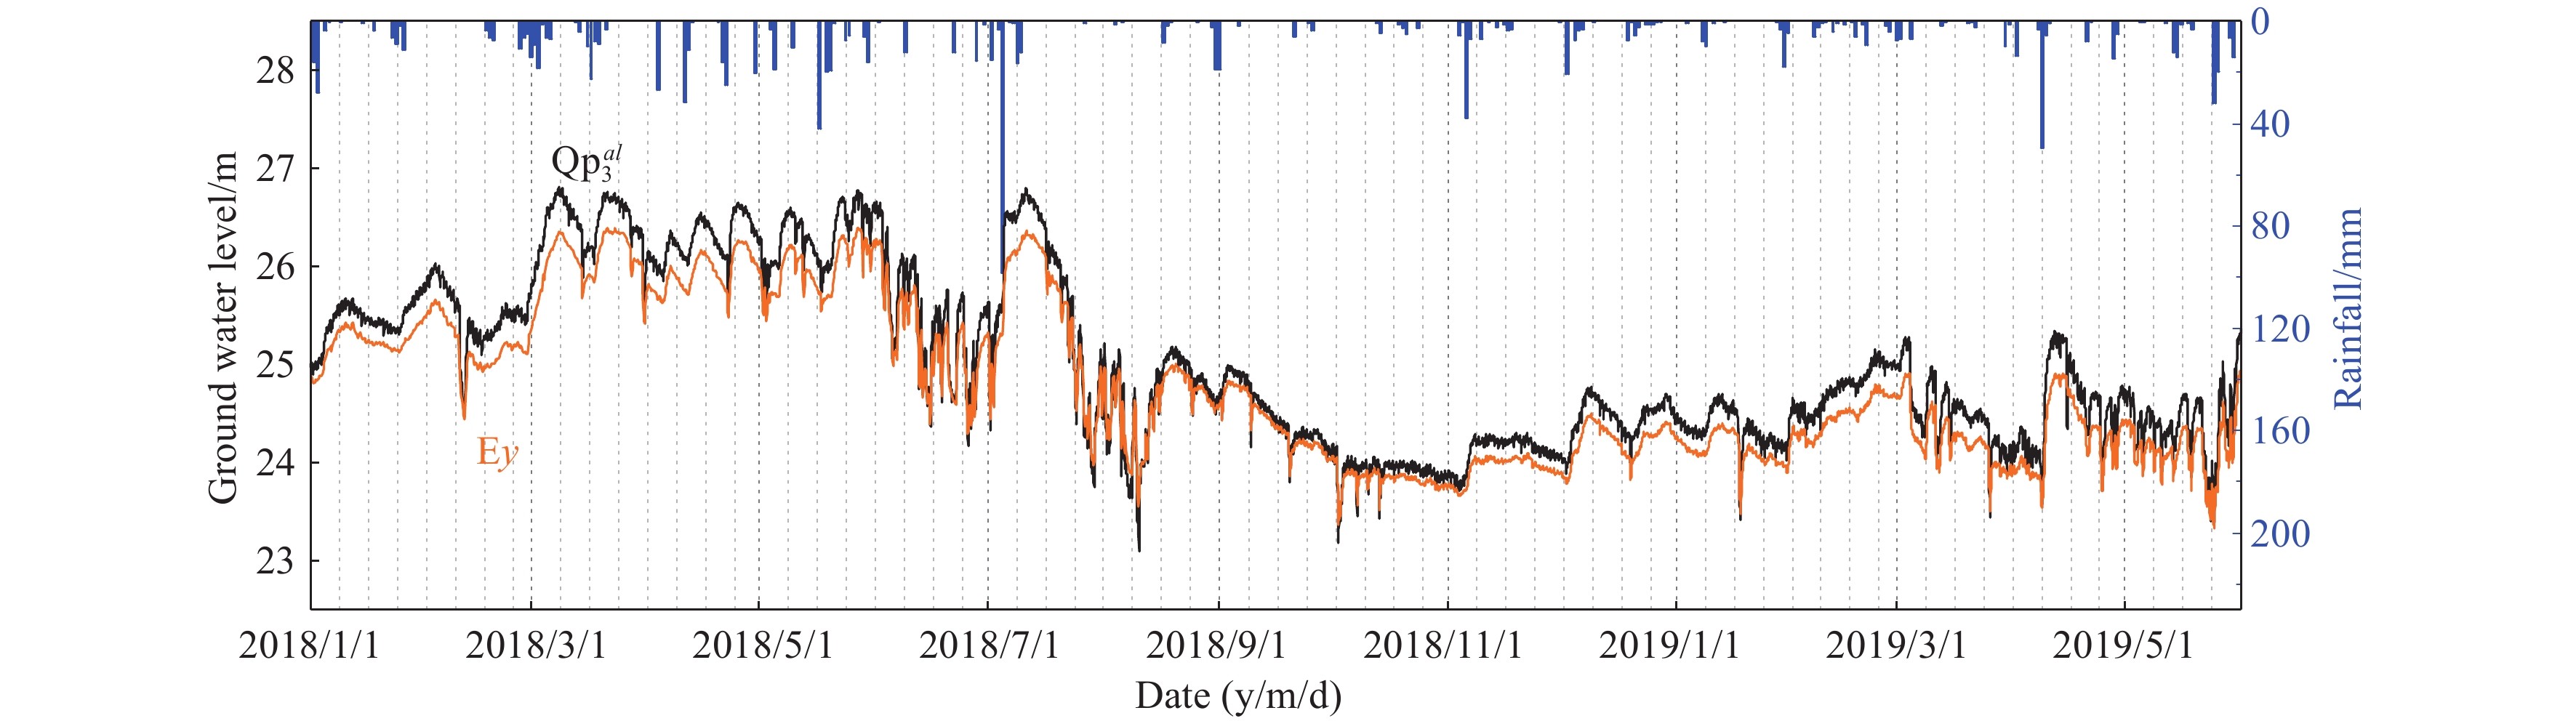
    This system was located at the northeast of the field test site, and mainly aimed at monitoring normal meteorological factors (Table 3) in order to document the amount of water and energy the soil received. Rainfall and evaporation were monitored online once a day. Other factors in Table 5 were monitored online every 10 minutes in the meteorological monitoring system since Jun. 1st, 2018.

    Table 5.  Monitoring equipment and factors of the meteorological monitoring system.
    Equipment modelFactorCompanyFrequency
    TE525MMRainfallCampbell, AmericaOnce a day
    255-100Evaporation
    LI190RPhotosynthetically active radiation
    CRN4Net solar radiation
    034BWind speed, Wind directionEvery 10 minutes
    CS100Atmospheric pressure
    HMP155AAir temperature,Air humidity
     | Show Table
    DownLoad: CSV

    The authors got the daily rainfall data of Xiaogan rainfall station (station number: 57482) from Jan. 1st, 2016 to Aug. 31st, 2018 from the Xiaogan Meteorological Bureau to help study this issue.

    The authors constructed a 20.00 m deep hydrogeological borehole named SYC-01 at the southwest of the field test site. 110 mm diameter porous PVC pipe was used to be the well wall between the depths of 15.00 m and 18.00 m in order to let the groundwater of Qp3al aquifer in. Other parts of the hydrogeological well wall were PVC pipe with 110 mm diameter. The groundwater monitoring system mainly aimed at monitoring the dynamic changes of the shallow confined groundwater level. The factors measured in the groundwater system were water level, temperature, and electrical conductivity of groundwater (Table 6). These factors were monitored online every 10 minutes by groundwater probe (Solinst levelogger Ⅲ 3001) hung at 14.85 m deep with wire rope since Jun. 1st, 2018.

    Table 6.  Information of groundwater monitoring system.
    AquiferBorehole numberEquipment modelFactorCompany
    Qp3alSYC-01Levelogger Ⅲ 3001Water level, Temperature, Electrical conductivitySolinst, Canada.
     | Show Table
    DownLoad: CSV

    Factors which couldn’t be monitored automatically by these three monitoring systems in Table 3 were monitored and sampled manually. The authors take soil moisture samples for hydrochemistry, stable hydrogen and oxygen isotopes, heavy metal pollutants, and pesticide pollutants tests by using soil solution sampler (KH100R, Made in China) in situ. Groundwater samples were taken from Qp3al sand-gravel aquifer in borehole SYC-01.

    All the data were processed by using Excel 2010. All the figures were plotted by using Origin 2017 and Auto CAD 2007.

    The authors used the groundwater level dynamic data (Qp3al sand-gravel aquifer and Ey pore-fissure aquifer) and the daily rainfall data (from Jan. 1st, 2018 to Jun. 1st, 2019) to draw Fig. 5 in order to analyze the relationship between rainfall and groundwater.

    Figure 5.  Dynamic diagram of rainfall and groundwater levels.
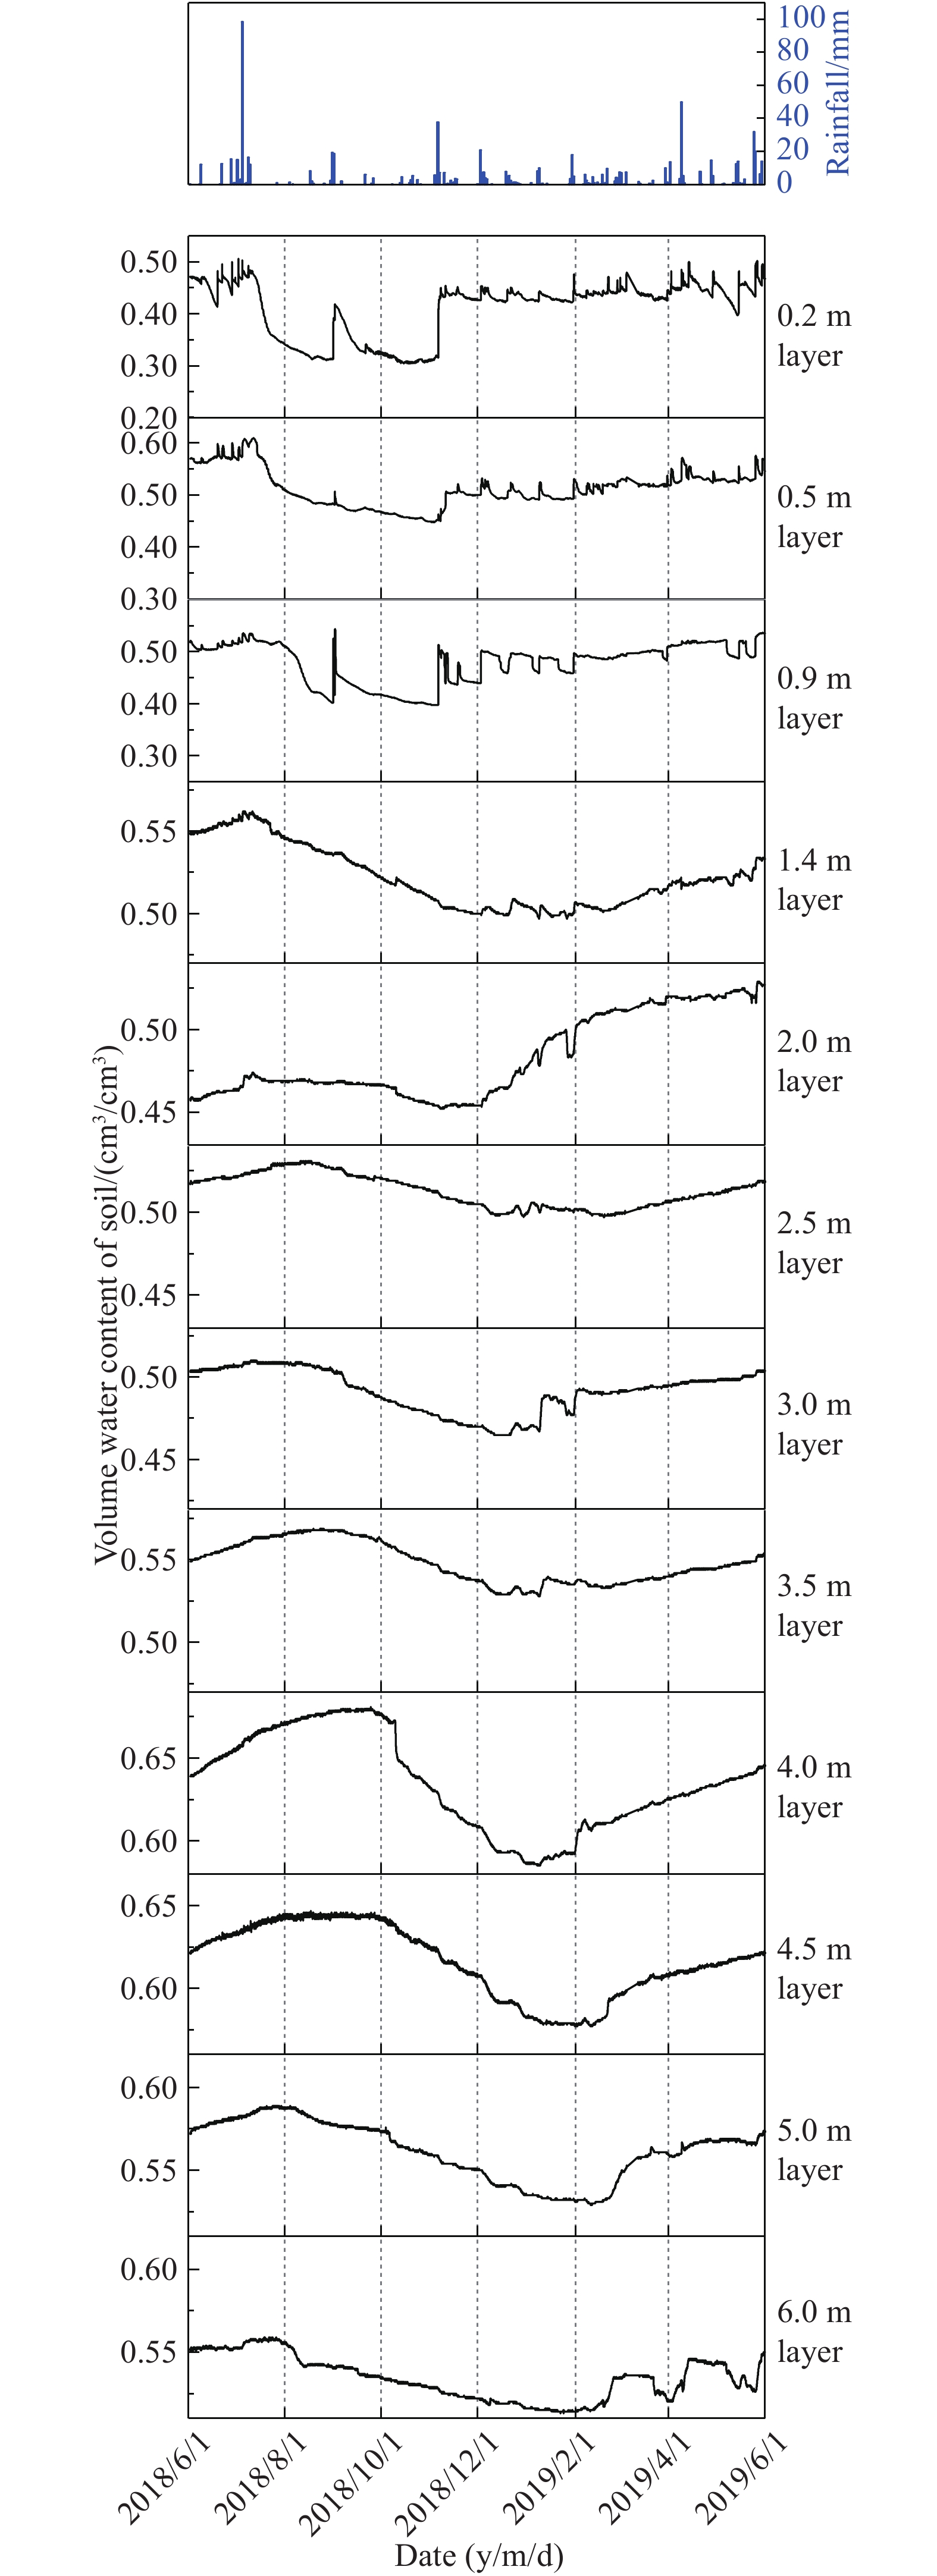
    As can be seen in Fig. 5, the groundwater level has a positive reaction to the rainfall and grows sharply following the rain. The rainfall was recorded at 98.4 mm beginning when the groundwater level of Qp3al aquifer was 25.59 m (depth of 7.80 m) at 23:00 on Jul. 4th, 2018. According to the groundwater level data (every 10 minutes) of Qp3al aquifer, the groundwater level began to grow one hour after it started to rain and reached the stable peak of 26.52 m at 12:20 on Jul. 5th, 2018. The growth rate of the groundwater level of Qp3al aquifer was about 0.075 m/h during this period. The saturated vertical hydraulic conductivity of cohesive soil the authors measured in the laboratory was about 10-3 m/d. If the growth of the groundwater level of Qp3al aquifer is caused by the vertical infiltration of rainfall at the field test site, the average vertical hydraulic conductivity of cohesive soil should be 187.20 m/d. The groundwater level of Qp3al sand-gravel aquifer was higher than Ey pore-fissure aquifer all the time during the monitored period in Fig. 5; this means that the Ey pore-fissure aquifer accepted the downward recharge from Qp3al sand-gravel aquifer during that time. It’s obvious that the cohesive soil having a vertical hydraulic conductivity of 187.20 m/d doesn’t align with common sense, so the shallow confined aquifer must not accept the vertical rainfall infiltration recharge of the field test site directly. Based on these two points, the authors believe that the growth of the groundwater level of Qp3al sand-gravel aquifer is caused by lateral recharge from other aquifer or rainfall recharge of the junction zone between mountain and basin by means of pressure conduction, which is consistent with researches by Chang W et al. (2019) and Liu XR et al. (2019).

    Groundwater is the main water source for drinking and irrigation in Xiaogang, where the field test site is located. There was little rain but very strong exploitation of groundwater from May. 31st to Jul. 4th in Xiaogang. It can be find that the fluctuation of Qp3al groundwater level (SYC-01) was mainly caused by the intermittent exploitation of groundwater in the aquifer as is shown in Fig. 5.

    The land type which 3E profile monitored was bare land before Jun. 2019. The data (VWC, and soil water potential) of 3E profile and rainfall data the authors used were monitored from Jun. 1st, 2018 to Jun. 1st, 2019. Based on these data during this period, Fig. 6 and Fig. 7 were plotted to show the change of volume water content and soil water potential affected by rainfall over time.

    Figure 6.  Dynamic diagram of rainfall and soil VWC in the profile 3E.
    Figure 7.  Dynamic diagram of rainfall and soil water potential in the profile 3E.
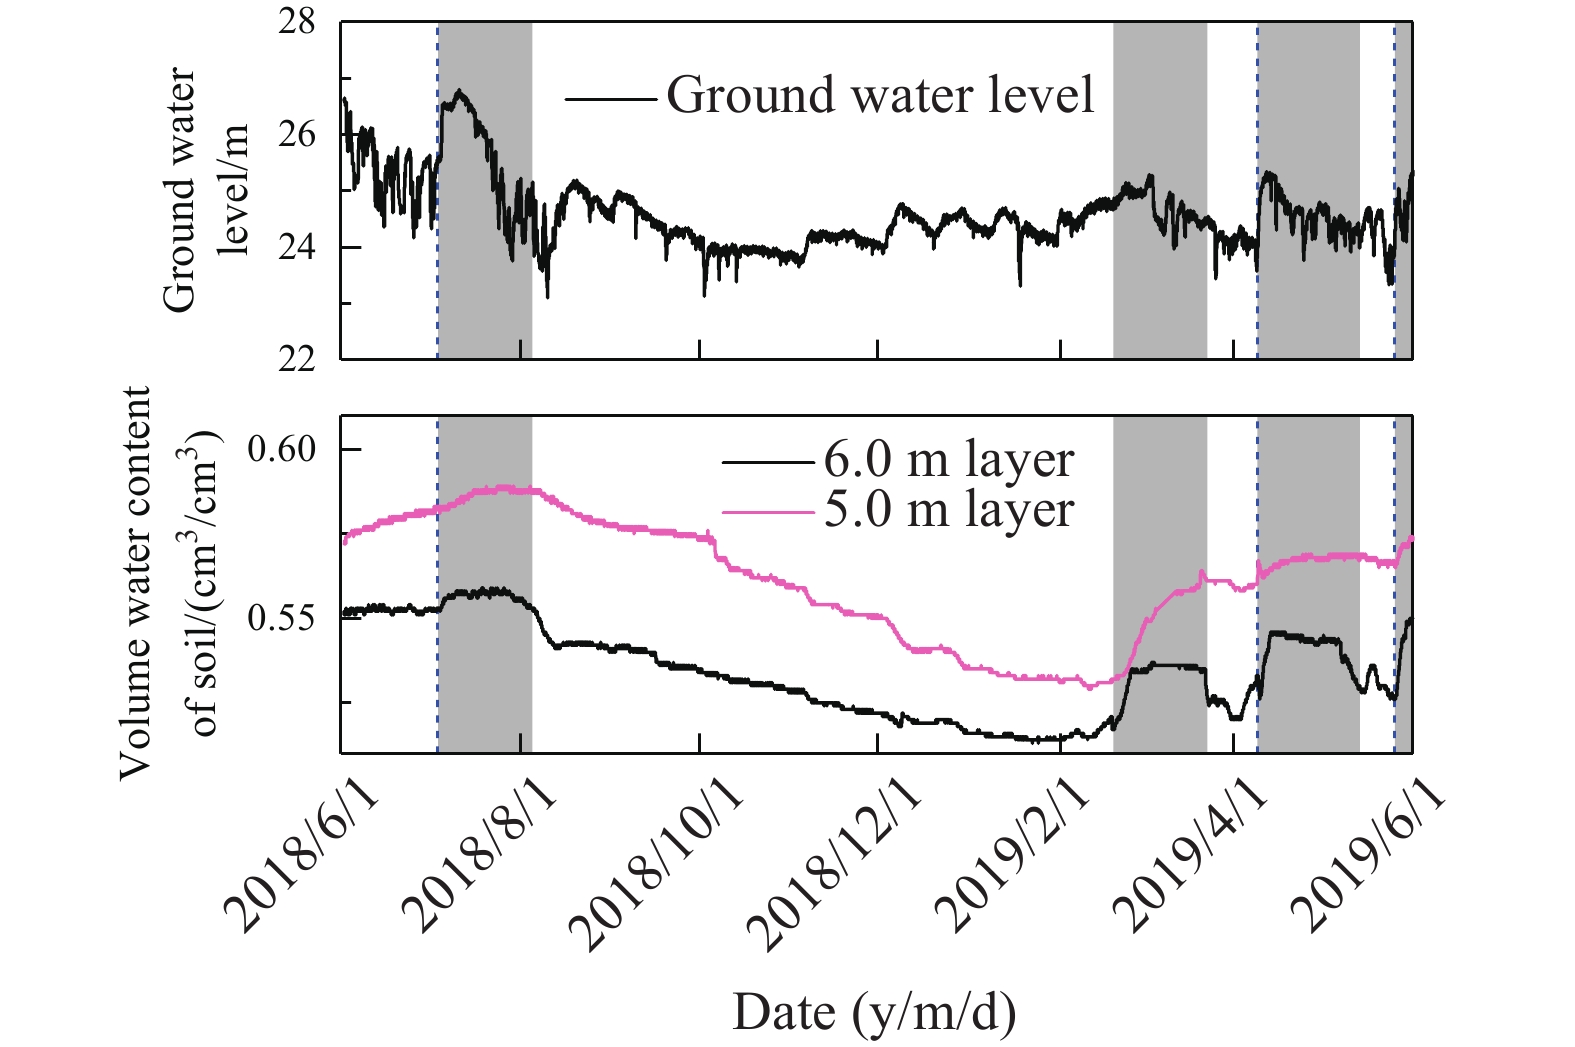
    According to the classifications of rainfall pattern (Table 7) by China Meteorological Administration, 120 rainfalls received in the field test site during the study period were classified into different patterns (Table 8). Because the minimum depth of the monitoring probe in soil is 0.2 m, the rainfall which caused a water migration less than 0.2 m below the ground can’t be detected by the probe and is considered to be invalid rain. The invalid rain can be stored in the surface layer of soil for a short time and evaporates quickly.

    Table 7.  Classifications of rainfall pattern.
    Rainfall patternAmount/mm
    Light rain0.1–9.9
    Moderate rain10.0–24.9
    Heavy rain25.0–49.9
    Torrential rain50.0–99.9
    Downpour100.0–249.9
     | Show Table
    DownLoad: CSV
    Table 8.  Statistics of rainfall data in the field test site.
    Rainfall patternAmount/mmTimesAccumulated amount/mm
    Light rain0.1–8.3100267.8
    Moderate rain12.1–21.016249.3
    Heavy rain32.0–49.73119.5
    Torrential rain98.4198.4
    Downpour/00
    Total/120735.0
    Note: / means not exist in the field test site.
     | Show Table
    DownLoad: CSV

    The amount of invalid rain was less than 3.1 mm according to the dynamic change of volume water content of layer 0.2 m in Fig.6. There were 45 invalid rains and 75 effective rains during the study period. The amount of effective rains was 672.9 mm in total. The effective rates of rainfall amounts and times are 62.50% and 91.56%. The δD and δ18O weighted average (weighted by rainfall amount) of rainfall in summer and autumn were closer to the δD and δ18O of soil moisture in the vertical soil profile at the field test site. Rainfalls in summer and autumn were the main supply source of soil moisture in the field test, and they experienced a certain degree of evaporation during infiltration (Liu TW et al., 2020).

    It rained a lot from Jun. 15th to Jul. 12th. The VWC of monitoring soil layers were high in value overall ranges from 0.35 cm3/cm3 to 0.67 cm3/cm3 with a change of no more than ±0.05 cm3/cm3 (Fig. 6). The VWC of the soil layer within depth of 1.4 m responded quickly to the rain and it changed relatively much more than other layers. The soil water potential changed little and the upper layer was larger than the lower layer during this period (Fig. 7). There was a positive water potential gradient existing from the upper layer to every lower layer, as soil moisture continued to move downward. Rainfall infiltration was slightly higher than infiltration and evaporation in the soil layer; soil moisture accumulated slowly no more than 0.05 cm3/cm3 during this period. Because of the high temperatures with strong evaporation in hot summer and the existence of soil macro pores, the water potential of soil layers within the depth of 0.2 m reacted relatively obviously to the rain.

    The field test area entered a drought period with the sharp decrease of rainfall both in frequency and amount from Jul. 12th to Sep. 1st in 2018. During this period, the evaporation intensity increased, and the accumulated evaporation was much larger than the cumulative rainfall amount. It can be seen in Fig. 7 that the water potential began to decline at different moments in the order of depth from small to large, and the water potential shows a decreasing trend during this period as well. The VWC of soil above the depth of 2.5 m was affected by the drought and started to decrease on Jul. 21st, 2018. The soil moisture supply was less than the sum of downward infiltration and evaporation in the soil zone to the depth of 2.5 m because of a month and a half of drought since Jun. 12th, 2018. The difference of water potential between 0.9 m layer and 1.4 m layer on Aug. 30th was –35 kPa, the gravity potential could no longer drive the downward migration of soil moisture at that moment. The decrease of VWC of soil above the depth of 1.4 m was caused by evaporation only, which means that the depth of evaporation was no less than 1.4 m.

    In order to study the law of soil moisture movement, the authors analyzed the data about VWC and the water potential of soil profile 3E in a complete hydrologic year from Jun. 1st, 2018 to Jun. 1st, 2019. There was a positive water potential gradient existing from the upper layer to every lower layer and in general, soil moisture kept moving downward.

    It can be seen from Fig. 6 that the soil profile could be mainly divided into four zones. The VWC of soil above the depth of 1.4 m layer are sensitive and respond quickly to every effective rain. Soil moisture fluctuates greatly in the depth range of 0 m to 0.9 m and the wetting front takes less than 1 hour in moving to 0.9 m layer from the 0.2 m layer for almost all the rain. The fluctuation range of soil moisture decreases gradually with the increase of depth in the range of 0.9 m to 1.4 m and the same wetting front from the upper layer takes about 12 hours to get through this 0.5 m of thick soil. The response of the soil layer to rainfall infiltration and evaporation is relatively active in the depth range of 0 m to 1.4 m, so it is considered to be the sensitive zone of rainfall infiltration. Soil moisture in the depth range of 1.4 m to 3.5 m responds much slower to the rain than that of the sensitive zone and its fluctuation decreases gradually with the increase of depth. Depth from 1.4 m to 3.5 m is considered to be the buffer zone of rainfall infiltration. In the depth range of 3.5 m to 5.0 m, the soil moisture shows a seasonal upward and downward trend as the time goes by, which is considered to be the rainfall infiltration migration zone. The zone below 5.0 m has a similar trend in soil VWC and soil water potential to the rainfall infiltration migration zone, but there were obvious peaks of soil VWC in four periods (from Jul. 4th, 2018 to Aug. 5th, 2018; from Feb. 19th, 2019 to Mar. 23rd, 2019; from Apr. 9th, 2019 to May. 14th, 2019; from May. 26th, 2019 to Jun. 1st, 2019) during the hydrologic year. There should be other factors affecting the soil VWC of the zone below 5.0 m besides the rainfall infiltration.

    The pore water pressure of the cohesive soil covered on the confined aquifer is in relative balance with the pressure at the top of the aquifer under natural conditions (Sun J, 1992). The groundwater level of SYC-01 reflects the shallow confined groundwater pressure of Quaternary Upper Pleistocene (Qp3al) stratum in the field test site. The pore water pressure of confined groundwater decreases when the groundwater level drops down. In this situation, the cohesive soil at bottom releases water to recharge the groundwater with a decrease of soil VWC. The groundwater recharges the cohesive soil at bottom when the pore water pressure of confined groundwater increases due to the increase of groundwater level. Then, the soil VWC is increased.

    In view of the doubt that the soil moisture in the depth range of 5.0 m to 6.0 m is affected by other factors in the analysis in chapter 4.2, the soil moisture data (5.0 m layer and 6.0 m layer) and the groundwater level data of Qp3al sand-gravel aquifer during the monitoring period are used to plot dynamic diagram (Fig. 8) for analysis.

    Figure 8.  Dynamic diagram of soil VWC (5.0m, 6.0m) and groundwater.

    The elevations of 5.0 m layer and 6.0 m layer are 28.40 m and 27.40 m. The elevation of groundwater level changes between 23.10 m and 26.80 m. The vertical distance between the groundwater level and 6.0 m layer (5.0 m layer) is from 0.60 m to 4.30 m (from 1.60 m to 5.30 m). In Fig. 8, it can be found roughly the same change trend in soil VWC of the 6.0 m layer and the groundwater level. Besides, the rise of groundwater level coincides with the time when the soil VWC of the two soil layers (5.0 m, 6.0 m) started to increase, and the soil VWC responded rapidly to the change of groundwater level. According to the distribution of hydrogen and oxygen isotope values in the profile of boreholes (ZK1 and ZK2) in the test field site, the hydrogen and oxygen isotope values of surface soil moisture were on the positive side, which shows obvious evidence of evaporation. The vertical distribution characteristics of δD and δ18O values in the range of 0 m to 6.2 m indicate the migration of rainfall on the vadose zone profile obviously (Liu TW et al., 2020). Affected by groundwater level, the δD and δ18O values of soil moisture in the depth of 6.6 m to 9.3 m (ZK1) show an inflection point with a positive deviation close to groundwater. The 13.8 m deep layer of the gray-black muddy sand layer had a relatively strong permeability coefficient as compared to the silty loam which caused stronger affection by groundwater than soil layers at depths of 6.6 m to 9.3 m.

    Finally, the soil zone below 5.0 m is considered to be the rainfall infiltration and groundwater level co-influenced zone. The deeper the layer below 5.0 m, the much more obviously affected by the change of the groundwater level.

    The groundwater level of Quaternary Upper Pleistocene (Qp3al) shallow confined aquifer is sensitive to the rain. The main recharge of groundwater is the lateral recharge from other aquifers or rainfall recharge of the junction zone between mountain and basin by way of pressure conduction. The Qp3al aquifer accepts a small amount of recharge from the rainfall of the field test site and the relatively great fluctuation of Qp3al groundwater level (SYC-01) is mainly caused by the intermittent exploitation of groundwater.

    There were 120 rainfalls (45 invalid rains and 75 effective rains) at the field test site during the study period. The amount of effective rains was 672.9 mm in total. The effective rates of rainfall amounts and times are 62.50% and 91.56%. The maximum depth of evaporation reached no less than 1.4 m.

    The soil profile in the field test site could be mainly divided into four zones. The rainfall infiltration and evaporation were relatively active and the soil VWC was sensitive to the rain in the depth range of 0 m to 1.4 m. Materials and energy exchanged frequently at the atmosphere-soil interface, so it was considered to be the sensitive zone of rainfall infiltration. Soil moisture in the depth range of 1.4 m to 3.5 m responded much slower to the rain than that of the sensitive zone and its fluctuation decreased gradually with the increase of depth. Depth from 1.4 m to 3.5 m was considered to be the buffer zone of rainfall infiltration. In the depth range of 3.5 m to 5.0 m, the soil moisture shows a seasonal upward and downward trend as the time goes by, which was considered to be the rainfall infiltration migration zone. The zone below 5.0 m had the similar trend in soil VWC and soil water potential to the rainfall infiltration migration zone; it was considered to be the rainfall infiltration and groundwater level co-influenced zone. The deeper the layer below 5.0 m, the much more obviously affected by the change of the groundwater level.

    Tian-wen Liu and Ting-ting Shi conceived of the presented idea. Tian-wen Liu, Cheng Hu, Kun Huang, and Qing Wang developed the theory, designed and built the field test site, and analyzed the data. Tian-wen Liu wrote the original draft. Qing Wang and Jun Li reviewed and edited the manuscript. Zhi-hua Chen supervised the findings of this work. All authors discussed the results and contributed to the final manuscript.

    The authors declare no conflict of interest.

    This research was financially supported by the project “1: 50000 regional hydrogeological survey in the Dabie Mountains contiguous destitute area” (121201009000172522) from Wuhan Center of Geological Survey, China Geological Survey (CGS).

  • [1] Brewer PE, Calderon F, Vigil M, Von Fischer JC. 2018. Impacts of moisture, soil respiration, and agricultural practices on methanogenesis in upland soils as measured with stable isotope pool dilution. Soil Biology & Biochemistry, 127, 239–251. doi: 10.1016/j.soilbio.2018.09.014

    CrossRef Google Scholar

    [2] Brinkmann N, Seeger S, Weiler M, Buchmann N, Eugster W, Kahmen A. 2018. Employing stable isotopes to determine the residence times of soil water and the temporal origin of water taken up by Fagus sylvatica and Picea abies in a temperate forest. New Phytologist, 219(4), 1300–1313. doi: 10.1111/nph.15255

    CrossRef Google Scholar

    [3] Chang W, Huang K, Hu C, Wang Q, Wang NT. 2019. Characteristics of the aquifer structure and groundwater conversion model in the northeastern Yunying Basin. Hydrogeology & Engineering Geology, 46(5), 9–15+23 (in Chinese with English abstract). doi: 10.16030/j.cnki.issn.1000-3665.2019.05.02.

    Google Scholar

    [4] Che CW, Zhang MJ, Argiriou AA, Wang SJ, Du QQ, Zhao PP, Ma ZZ. 2019. The stable isotopic composition of different water bodies at the soil-plant-atmosphere continuum (SPAC) of the Western Loess Plateau, China. Water, 11(9). doi: 10.3390/w11091742.

    Google Scholar

    [5] Chen SN, He JT, Jin AF, Wei YX. 2010. Distribution characteristics of PAHs in soil profiles of different irrigation areas. Environmental Science & Technology, 33(10), 10–14+63 (in Chinese with English abstract). doi: 10.3969/j.issn.1003-6504.2010.10. 003.

    Google Scholar

    [6] Chen SY, Guo YZ, Zheng YX, Wang JS. 2012. Impart of rainfall on soil moisture in Gansu arid agricultural regions. Journal of Desert Research, 32(1), 155–162 (in Chinese with English abstract).

    Google Scholar

    [7] Chen W, Li QH, Yu SW, Liu HQ. 2017. Hydrochemical characteristics and ion sources of groundwater in Fangcheng district, Guangxi. Geology and Mineral Resources of South China, 32(1), 162–168 (in Chinese with English abstract). doi: 10.3969/j.issn.1007-3701.2017.02.007.

    Google Scholar

    [8] Cremer CJM, Neuweiler I, Bechtold M, Vanderborght J. 2016. Solute transport in heterogeneous soil with time-dependent boundary conditions. Vadose Zone Journal, 15(6). doi: 10.2136/vzj2015.11.0144.

    Google Scholar

    [9] Deng QJ, Tang ZH. 2014. Soil-groundwater geological environment integrated monitoring and evaluation in Jianghan Plain. Hydrogeology & Engineering Geology, 41(4), 131–135+142 (in Chinese with English abstract). doi: 10.16030/j.cnki.issn.1000-3665. 2014.04.028.

    Google Scholar

    [10] Gazis C, Feng XH. 2004. A stable isotope study of soil water: Evidence for mixing and preferential flow paths. Geoderma, 119(1–2), 97–111. doi: 10.1016/S0016-7061(03)00243-X

    CrossRef Google Scholar

    [11] Gomez I, Caselles V, Estrela MJ, Sanchez JM, Rubio E, Miro JJ. 2018. Improved meteorology and surface fluxes in mesoscale modelling using adjusted initial vertical soil moisture profiles. Atmospheric Research, 213, 523–536. doi: 10.1016/j.atmosres.2018.06.020

    CrossRef Google Scholar

    [12] Haverd V, Cuntz M, Leuning R, Keith H. 2007. Air and biomass heat storage fluxes in a forest canopy: Calculation within a soil vegetation atmosphere transfer model. Agricultural and Forest Meteorology, 147(3–4), 125–139. doi: 10.1016/j.agrformet.2007.07.006

    CrossRef Google Scholar

    [13] He MN, Tong YP, Wang YQ, Lu YD, Zhao YL. 2017. A case study on the effects of micro-topography and rainfall events on 0–5 m soil moisture at a slope of the Loess Plateau. Journal of Earth Environment, 8(4), 357–366 (in Chinese with English abstract). doi: 10.7515/JEE201704008.

    Google Scholar

    [14] Hu MY, Wang Q, Chen ZH, Hu C. 2018. Characteristics of hydrogen and oxygen isotopes of shallow groundwater in the north area of Yunying Basin. Safety and Environmental Engineering, 25(5), 9–14 (in Chinese with English abstract). doi: 10.13578/ j.cnki.issn.1671-1556. 2018.05.002.

    Google Scholar

    [15] Huang H, Chen ZH, Wang T, Xiang CJ, Zhang L, Zhou GM, Sun BT, Wang Y. 2019. Nitrate distribution and dynamics as indicators to characterize karst groundwater flow in a mined mineral deposit in southwestern China. Hydrogeology Journal, 27, 2077–2089. doi: 10.1007/s10040-019-01987-0

    CrossRef Google Scholar

    [16] Huo SY, Jin MG, Liang X, Li X, Hao HB. 2020. Estimating impacts of water-table depth on groundwater evaporation and recharge using lysimeter measurement data and bromide tracer. Hydrogeology Journal, 28(3), 955–971. doi: 10.1007/s10040-019-02098-6

    CrossRef Google Scholar

    [17] Kafaei R, Arfaeinia H, Savari A, Mahmoodi M, Rezaei M, Rayani M, Ramavandi B. 2020. Organochlorine pesticides contamination in agricultural soils of southern Iran. Chemosphere, 240, 124–983. doi: 10.1016/j.chemosphere.2019.124983

    CrossRef Google Scholar

    [18] Li FD, Song XF, Tang CY, Liu CM, Yu JJ, Zhang WJ. 2007. Tracing infiltration and recharge using stable isotope in Taihang Mt., North China. Environmental Geology, 53(3), 687–696. doi: 10.1007/s00254-007-0683-0

    CrossRef Google Scholar

    [19] Li JQ, Ma T, Deng YM, Du Y, Wang ZQ, Jiang YH. 2019. Progresses on monitoring network construction of Earth’s Critical Zone in Jianghan Plain. Geological Survey of China, 6(5), 115–123 (in Chinese with English abstract). doi: 10.19388/j.zgdzdc.2019.05. 13.

    Google Scholar

    [20] Lin D, Jin MG, Ma B, Wang BG. 2014. Characteristics of infiltration recharge at thickening vadose zone using soil hydraulic parameters. Earth Science (Journal of China University of Geoscience), 39(6), 760–768 (in Chinese with English abstract). doi: 10.3799/dqkx.2014.071.

    Google Scholar

    [21] Liu FF, Mao XS, Zhang JX, Wu Q, Li YY, Xu C. 2020. Isothermal diffusion of water vapor in unsaturated soils based on Fick’s second law. Journal of Central South University, 27(7), 2017–2031. doi: 10.1007/s11771-020-4427-6

    CrossRef Google Scholar

    [22] Liu LC, Chen HH, Yang Y, Wang JS. 2009. The effects of sedimentary environment and human activity on shallow groundwater quality in Suxichan area. Geology in China, 36(4), 915–919 (in Chinese with English abstract).

    Google Scholar

    [23] Liu TW, Pan Y, Hu C, Wang Q, Chen ZH, Shi TT. 2020. Tracing infiltration and recharge of thick silt by using D, 18O isotopes of soil moisture in Xiaogan, Hubei and its ecological effects. Geology in China (in Chinese with English abstract). https://kns.cnki.net/kcms/detail/11.1167.P.20200806.1544.008.html.

    Google Scholar

    [24] Liu XR, Wang Q, Chen ZH, Hu C. 2019. Study on groundwater conversion relationship in Piedmont Plain based on robust Regression-De-Trend fluctuation analysis. Safety and Environmental Engineering, 26(5), 17–24 (in Chinese with English abstract). doi: 10.13578/j.cnki.issn.1671-1556.2019.05.003.

    Google Scholar

    [25] Ma B, Liang X, Liu SH, Jin MG, Nimmo JR, Li J. 2017. Evaluation of diffuse and preferential flow pathways of infiltrated precipitation and irrigation using oxygen and hydrogen isotopes. Hydrogeology Journal, 25(3), 675–688. doi: 10.1007/s10040-016-1525-5

    CrossRef Google Scholar

    [26] Meng SH, Fei YH, Zhang ZJ, Qian Y, Li YS. 2011. Groundwater vulnerability assessment of North China Plain. Geology in China, 38(6), 1607–1613 (in Chinese with English abstract).

    Google Scholar

    [27] National Research Council. 2001. Basic Research Opportunities in Earth Sciences. Washington DC, National Academies Press, 35–45.

    Google Scholar

    [28] Pang ZH, Huang TM, Yang S, Yuan LJ. 2018. The potential of the unsaturated zone in groundwater recharge in arid and semiarid areas. Journal of Engineering Geology, 26(1), 51–61 (in Chinese with English abstract). doi: 10.13544/j.cnki.jeg.2018.01.006.

    Google Scholar

    [29] Qian Z, Mao Y, Xiong S, Peng B, Liu W, Liu HF, Qi SH. 2020. Historical residues of organochlorine pesticides (OCPs) and polycyclic aromatic hydrocarbons (PAHs) in a flood sediment profile from the Longwang Cave in Yichang, China. Ecotoxicology and Environmental Safety, 196, 110–542. doi: 10.1016/j.ecoenv.2020.110542

    CrossRef Google Scholar

    [30] Ren R, Ma JJ, Cheng QY, Zheng LJ, Guo XH, Sun XH. 2017. Modeling coupled water and heat transport in the root zone of winter wheat under non-isothermal conditions. Water, 9(4). doi: 10.3390/w9040290.

    Google Scholar

    [31] Shao W, Coenders-Gerrits M, Judge J, Zeng YJ, Su Y. 2018. The impact of non-isothermal soil moisture transport on evaporation fluxes in a maize cropland. Journal of Hydrology, 561, 833–847. doi: 10.1016/j.jhydrol.2018.04.033

    CrossRef Google Scholar

    [32] Song XF, Wang SQ, Xiao GQ, Wang ZM, Liu X, Wang P. 2009. A study of soil water movement combining soil water potential with stable isotopes at two sites of shallow groundwater areas in the North China Plain. Hydrological Processes, 23(9), 1376–1388. doi: 10.1002/hyp.7267

    CrossRef Google Scholar

    [33] Sprenger M, Tetzlaff D, Soulsby C. 2017. Soil water stable isotopes reveal evaporation dynamics at the soil-plant-atmosphere interface of the critical zone. Hydrology and Earth System Sciences, 21(7), 3839–3858. doi: 10.5194/hess-21-3839-2017

    CrossRef Google Scholar

    [34] Sun FQ, Yin LH, Wang XY, Ma HY, Zhang J, Dong JQ, He SJ. 2017. Determination of vertical infiltration recharge of groundwater in the thick unsaturated zone of Sangong River Basin, Xinjiang. Geology in China, 44(5), 913–923 (in Chinese with English abstract). doi: 10.12029/gc20170506.

    Google Scholar

    [35] Sun J. 1992. Leakage and sticky soil storage related to the evaluation of deep level pore water resource. Geology of Anhui, 2(3), 46–50 (in Chinese with English abstract).

    Google Scholar

    [36] Wan HL, Bian JM, Zhang H, Li YH. 2021. Assessment of future climate change impacts on water-heat-salt migration in unsaturated frozen soil using Coup Model. Frontiers of Environmental Science & Engineering, 15(10), . doi: 10.1007/s11783-020-1302-5

    CrossRef Google Scholar

    [37] Wang XJ, Piao XY, Chen J, Hu JD, Xu FL, Tao S. 2006. Organochlorine pesticides in soil profiles from Tianjin, China. Chemosphere, 64(9), 1514–1520. doi: 10.1016/j.chemosphere.2005.12.052

    CrossRef Google Scholar

    [38] Xiao DA, Wang SJ. 2009. Comments on the progress and direction in soil moisture research. Ecology and Environmental Sciences, 18(3), 1182–1188 (in Chinese with English abstract). doi: 10.16258/j.cnki.1674-5906.2009.03.054.

    Google Scholar

    [39] Xu YD, Wang JK, Gao XD, Zhang YL. 2018. Application of hydrogen and oxygen stable isotope techniques on soil moisture research: A Review. Journal of Soil and Water Conservation, 32(3), 1–9+15 (in Chinese with English abstract). doi: 10.13870/j.cnki.stbcxb. 2018.03.001.

    Google Scholar

    [40] Yang J, Xiao TY, Li HB, Wang QR. 2018. Spatial distribution and influencing factors of the NO3-N concentration in groundwater in Jianghan Plain. China Environmental Science, 38(2), 710–718 (in Chinese with English abstract). doi: 10.19674/j. cnki.issn1000-6923.2018.0084.

    Google Scholar

    [41] Yang JF. 1999. A review on water exchange through interface between groundwater, soil moisture or atmospheric water. Advances in Water Science, 10(2), 84–90 (in Chinese with English abstract). doi: 10.14042/j.cnki.32.1309.1999.02.016.

    Google Scholar

    [42] Yuan RQ, Song XF, Han DM, Zhang YH, Zhang L, Zhang B, Yu YL. 2012. Rate and historical change of direct recharge from precipitation constrained by unsaturated zone profiles of chloride and oxygen-18 in dry river bed of North China Plain. Hydrological Processes, 26(9), 1291–1301. doi: 10.1002/hyp.8207

    CrossRef Google Scholar

    [43] Zhang CX, Liao XP, Li JL, Xu L, Liu M, Du B, Wang YX. 2013. Influence of long-term sewage irrigation on the distribution of organochlorine pesticides in soil-groundwater systems. Chemosphere, 92(4), 337–343. doi: 10.1016/j.chemosphere.2013.01.020

    CrossRef Google Scholar

    [44] Zhang GL, Zhu YG, Shao MG. 2019. Understanding sustainability of soil and water resources in a critical zone perspective. Science China Earth Sciences, 62, 1716–1718. doi: 10.1007/s11430-019-9368-7

    CrossRef Google Scholar

    [45] Zhang JX, Wang X, Wang YK, Jing SS, Dong JG, Wang ZT. 2017. Regularities of rainfall infiltration and water migration in woodland drying soil in the Loess Hilly Region. Journal of Soil and Water Conservation, 31(3), 231–238 (in Chinese with English abstract). doi: 10.13870/j.cnki.stbcxb.2017.03.039.

    Google Scholar

    [46] Zhao DJ, Liu ZP, Xiong QH. 2007. The vulnerability evaluation for groundwater pollution in Jianghan Plain. Resources Environment & Engineering, (S1), 64–67 (in Chinese with English abstract). doi: 10.16536/j.cnki.issn.1671-1211.2007.s1.029.

    Google Scholar

    [47] Zhao J, Chen ZH, Wang T, Xiang CJ, Luo MM, Yuan HX. 2019. Control of contaminant transport caused by open-air heavy metal slag in Zhehai, Southwest China. International Journal of Environmental Research and Public Health, 16(3). doi: 10.3390/ijerph16030443.

    Google Scholar

    [48] Zhao Y, Ling DS, Wang YL, Huang B, Wang HL. 2016. Study on a calibration equation for soil water content in field tests using time domain reflectometry. Journal of Zhejiang University-SCIENCE A (Applied Physics & Engineering), 17(3), 240–252. doi: 10.1631/jzus.A1500065

    CrossRef Google Scholar

    [49] Zhu HY, Jia ZF, Li PC, Liu XH. 2014. Transport mode of soil moisture in arid areas considering air effect. Transactions of the Chinese Society of Agricultural Machinery, 45(12), 126–138 (in Chinese with English abstract). doi: 10.6041/j.issn.1000-1298.2014.12.020.

    Google Scholar

  • Related articles

    [1] HE Qixiang. A DISCUSSION ON SEDIMENT DYNAMICS. Marine Geology & Quaternary Geology, 2010, 30(4): 1-1. doi: 10.3724/SP.J.1140.2010.04001
    [2] LI Yanzhen,  XU Hehua. DYNAMIC SIMULATION FOR SPREADING MECHANISM OF SOUTH CHINA SEA. Marine Geology & Quaternary Geology, 2016, 36(2): 75-75. doi: 10.16562/j.cnki.0256-1492.2016.02.009
    [3] LI Sanzhong,  SUO Yanhui,  LIU Xin,  DAI Liming,  YU Shan,  ZHAO Shujuan,  MA Yun,  WANG Xiaofei,  CHENG Shixiu,  AN Huiting,  XUE Youchen,  XIONG Lijuan,  CAO Xianzhi,  XU Liqing. BASIN DYNAMICS AND BASIN GROUPS OF THE SOUTH CHINA SEA. Marine Geology & Quaternary Geology, 2012, 32(6): 55-55. doi: 10.3724/SP.J.1140.2012.06055
    [4] NIU Shuyin,  SUN Aiqun,  WANG Mengke,  ZUO Liming,  ZHANG Xunhua,  ZHANG Fuxiang,  HOU Jianglong,  XU Meng,  ZHANG Jianzhen,  CHEN Chao. THE FORMATION OF BOHAI SEA AND ITS DEEP DYNAMICS. Marine Geology & Quaternary Geology, 2014, 34(6): 63-63. doi: 10.3724/SP.J.1140.2014.06063
    [5] XIE Dong-feng,  FAN Dai-du,  GAO Shu. FLAT OF CHONGMING ISLAND AND ITS IMPACTS ON THE SEDIMENT DISTRIBUTION. Marine Geology & Quaternary Geology, 2006, 26(2): 9-9.
    [6] CHEN Ping,  ZHENG Yanpeng,  LIU Baohua. GEOPHYSICAL FEATURES OF THE NANKAI TROUGH SUBDUCTION ZONE AND THEIR DYNAMIC SIGNIFICANCE. Marine Geology & Quaternary Geology, 2014, 34(6): 153-153. doi: 10.3724/SP.J.1140.2014.06153
    [7] DONG Hao, DAI Liming, LI Sanzhong, HU Zeming. Dynamic connection between Archean magma vents and Dome-and-Keel Structures. Marine Geology & Quaternary Geology, 2020, 40(4): 116-116. doi: 10.16562/j.cnki.0256-1492.2020050301
    [8] HU Mengying, LI Sanzhong, DAI Liming, SUO Yanhui, GUO Lingli, LIU Ze, MA Fangfang, TAO Jianli. NUMERICAL DYNAMIC MODELING OF TECTONIC INVERSION IN THE NORTHEASTERN XIHU SAG. MARINE GEOLOGY AND QUATERNARY GEOLOGY, 2017, 37(4): 151-151. doi: 10.16562/j.cnki.0256-1492.2017.04.010
  • Created with Highcharts 5.0.7Amount of accessChart context menuAbstract Views, PDF Downloads StatisticsAbstract ViewsPDF Downloads2024-052024-062024-072024-082024-092024-102024-112024-122025-012025-022025-032025-040Highcharts.com
    Created with Highcharts 5.0.7Chart context menuAccess Class DistributionFULLTEXT: 100.0 %FULLTEXT: 100.0 %FULLTEXTHighcharts.com
    Created with Highcharts 5.0.7Chart context menuAccess Area Distribution其他: 7.4 %其他: 7.4 %其他: 0.5 %其他: 0.5 %Beijing: 2.0 %Beijing: 2.0 %Haidian: 1.3 %Haidian: 1.3 %Mountain View: 2.5 %Mountain View: 2.5 %[]: 0.4 %[]: 0.4 %上海: 3.4 %上海: 3.4 %兰开斯特: 0.4 %兰开斯特: 0.4 %北京: 2.7 %北京: 2.7 %十堰: 0.5 %十堰: 0.5 %南京: 1.1 %南京: 1.1 %南通: 0.2 %南通: 0.2 %合肥: 0.4 %合肥: 0.4 %哥伦布: 0.2 %哥伦布: 0.2 %嘉兴: 0.7 %嘉兴: 0.7 %天津: 4.5 %天津: 4.5 %威海: 0.2 %威海: 0.2 %安康: 0.4 %安康: 0.4 %宣城: 0.7 %宣城: 0.7 %常州: 0.9 %常州: 0.9 %广州: 2.0 %广州: 2.0 %张家口: 1.6 %张家口: 1.6 %成都: 1.3 %成都: 1.3 %扬州: 3.8 %扬州: 3.8 %承德: 0.4 %承德: 0.4 %无锡: 0.2 %无锡: 0.2 %昆明: 0.4 %昆明: 0.4 %杭州: 3.6 %杭州: 3.6 %桂林: 0.7 %桂林: 0.7 %武汉: 1.1 %武汉: 1.1 %沈阳: 0.4 %沈阳: 0.4 %泰安: 0.4 %泰安: 0.4 %洛阳: 0.7 %洛阳: 0.7 %淄博: 0.2 %淄博: 0.2 %温州: 0.5 %温州: 0.5 %滨州: 0.4 %滨州: 0.4 %漯河: 10.4 %漯河: 10.4 %濮阳: 0.4 %濮阳: 0.4 %牡丹江: 0.7 %牡丹江: 0.7 %石家庄: 0.5 %石家庄: 0.5 %福州: 0.4 %福州: 0.4 %芒廷维尤: 18.9 %芒廷维尤: 18.9 %芝加哥: 1.8 %芝加哥: 1.8 %莫斯科: 0.7 %莫斯科: 0.7 %衡水: 0.4 %衡水: 0.4 %西宁: 2.7 %西宁: 2.7 %西安: 0.7 %西安: 0.7 %邯郸: 0.4 %邯郸: 0.4 %郑州: 0.9 %郑州: 0.9 %重庆: 0.7 %重庆: 0.7 %镇江: 0.4 %镇江: 0.4 %长春: 0.4 %长春: 0.4 %长沙: 7.5 %长沙: 7.5 %雅加达: 0.4 %雅加达: 0.4 %青岛: 4.3 %青岛: 4.3 %其他其他BeijingHaidianMountain View[]上海兰开斯特北京十堰南京南通合肥哥伦布嘉兴天津威海安康宣城常州广州张家口成都扬州承德无锡昆明杭州桂林武汉沈阳泰安洛阳淄博温州滨州漯河濮阳牡丹江石家庄福州芒廷维尤芝加哥莫斯科衡水西宁西安邯郸郑州重庆镇江长春长沙雅加达青岛Highcharts.com
通讯作者: 陈斌, bchen63@163.com
  • 1. 

    沈阳化工大学材料科学与工程学院 沈阳 110142

  1. 本站搜索
  2. 百度学术搜索
  3. 万方数据库搜索
  4. CNKI搜索

Figures(8)

Tables(8)

Article Metrics

Article views(1132) PDF downloads(15) Cited by(0)

Access History

Catalog

    /

    DownLoad:  Full-Size Img  PowerPoint
    • Table 1.  Table of the regional chronostratigraphy in the Jianghan Plain.
      ErathemSystemSeriesGroup/Formation/BedSymbolType and description of rock
      Cenozoic(Kz)Quaternary(Q)Holocene(Qh)QhalThe upper part is silty clay, sandy silt; the top part is medium sand with gravel; the bottom part is sandy gravel
      Pleistocene(Qp)Qp3alThe upper part is clay and silty clay with a different color; the bottom part is the sand-gravel layer
      Qp2al+plThe upper part is the sand-gravel layer; the top part is the net-like clay; the bottom part is sand-gravel layer with net-like clay
      Paleogene(E)YuntaiguanEyFuchsia sandstone, gravelly sandstone, sandy conglomerate
      Neoproterozoic
      (Pt3)
      Ediacaran/Sinian
      (Z/Sn)
      DoushantuoZ1dBlack siliceous rock
      Mesoproterozoic
      (Pt2)
      WudangQbW2Biotite-albit schist
       | Show Table
      DownLoad: CSV
    • Table 2.  Geological structure information of the field test site.
      Stratum symbolDepth/mElevation/
      m
      Main lithologyHydraulic conductivity (K)/(cm/s)Permeability
      Qp3al0–0.233.20Cultivated soil10–7–10–5Extremely low-weak
      0.2–12.5521.85Silty loam
      12.55–13.021.40Silty clay
      13.0–15.018.40Gray-black muddy sand\\
      15.0–18.015.40Sand-gravel1.3×10–2strong
       | Show Table
      DownLoad: CSV
    • Table 3.  Monitoring systems and factors.
      ObjectFactorMonitoring typeMonitoring system
      SoilVolume water content (VWC), soil electrical conductivity, soil water potential, soil temperature, surface heat fluxAutoSoil moisture monitoring system
      Soil moisture hydrochemistry, stable hydrogen and oxygen isotopes, heavy metal pollutants, pesticide pollutantsManual
      AtmosphereRainfall, evaporation, air temperature, humidity, wind speed, wind direction, atmospheric pressure, net solar radiation, photosynthetically active radiationAutoMeteorological monitoring system
      GroundwaterLevel, temperature, electrical conductivityGroundwater monitoring system
      Hydrochemistry, stable hydrogen and oxygen isotopes, pesticide pollutantsManual
       | Show Table
      DownLoad: CSV
    • Table 4.  Monitoring equipment and factors of the soil moisture monitoring system.
      Equipment modelFactorCompanyFrequency
      CS650Volume water content, electrical conductivity, soil temperatureCampbell, AmericaEvery 10 minutes
      CS257Soil water potential
      HFP01Surface heat flux
       | Show Table
      DownLoad: CSV
    • Table 5.  Monitoring equipment and factors of the meteorological monitoring system.
      Equipment modelFactorCompanyFrequency
      TE525MMRainfallCampbell, AmericaOnce a day
      255-100Evaporation
      LI190RPhotosynthetically active radiation
      CRN4Net solar radiation
      034BWind speed, Wind directionEvery 10 minutes
      CS100Atmospheric pressure
      HMP155AAir temperature,Air humidity
       | Show Table
      DownLoad: CSV
    • Table 6.  Information of groundwater monitoring system.
      AquiferBorehole numberEquipment modelFactorCompany
      Qp3alSYC-01Levelogger Ⅲ 3001Water level, Temperature, Electrical conductivitySolinst, Canada.
       | Show Table
      DownLoad: CSV
    • Table 7.  Classifications of rainfall pattern.
      Rainfall patternAmount/mm
      Light rain0.1–9.9
      Moderate rain10.0–24.9
      Heavy rain25.0–49.9
      Torrential rain50.0–99.9
      Downpour100.0–249.9
       | Show Table
      DownLoad: CSV
    • Table 8.  Statistics of rainfall data in the field test site.
      Rainfall patternAmount/mmTimesAccumulated amount/mm
      Light rain0.1–8.3100267.8
      Moderate rain12.1–21.016249.3
      Heavy rain32.0–49.73119.5
      Torrential rain98.4198.4
      Downpour/00
      Total/120735.0
      Note: / means not exist in the field test site.
       | Show Table
      DownLoad: CSV