

| Citation: |
Jin-qiang Liang, Wei Deng, Jing-an Lu, Zeng-gui Kuang, Yu-lin He, Wei Zhang, Yue-hua Gong, Jin Liang, Miao-miao Meng, 2020. A fast identification method based on the typical geophysical differences between submarine shallow carbonates and hydrate bearing sediments in the northern South China Sea, China Geology, 3, 16-27. doi: 10.31035/cg2020021

|
A fast identification method based on the typical geophysical differences between submarine shallow carbonates and hydrate bearing sediments in the northern South China Sea
-
Abstract
Bottom simulating reflector (BSR) has been recognized as one of the indicators of gas hydrates. However, BSR and hydrate are not one-to-one correspondence. In the Xisha area of South China Sea (SCS), carbonate rocks wildly develop, which continuously distribute parallel to the seafloor with high amplitude on seismic sections, exhibiting reflections similar to BSRs in the Shenhu area nearby. This phenomenon causes some interference to hydrates identification. In this paper, the authors discussed the typical geophysical differences between carbonate rocks and hydrates, indicating that the main difference exists in relationship between porosity and velocity, causing different amplitude versus offset (AVO) characters. Then the authors proposed a new model assuming that the carbonates form the matrix and the hydrate fill the pore as a part of the matrix. The key modeling parameters have been optimized constrained by P-velocities and S-velocities simultaneously, and the model works well both for carbonate rock and gas hydrate bearing sediments. For quantitative identification, the authors calculated the velocities when carbonates and hydrates form the matrix together in different proportions. Then they proposed a carbonate and hydrate identification template (CHIT), in which the possible hydrate saturation (PHS) and possible carbonate content (PCC) can be both scaled out for a group of sample composed by P-velocity and S-velocity. If PHS is far larger than PCC, it is more likely to be a hydrate sample because carbonates and hydrates do not coexist normally. The real data application shows that the template can effectively distinguish between hydrates and carbonate rocks, consequently reducing the risk of hydrate exploration.
-

-
References
[1] Backus GE. 1962. Long-wave elastic anisotropy produced by horizontal layering. Journal of Geophysical Research, 67(11), 4427–4440. doi: 10.1029/JZ067i011p04427 [2] Brown RJS, Korringa J. 1975. On the dependence of the elastic properties of a porous rock on the compressibility of the pore fluid. Geophysics, 40(4), 608–616. doi: 10.1190/1.1440551 [3] Berryman JG. 1995. Mixture theories for rock properties.//Ahrens T J. Rock physic and phase relation: A handbook of physical constant. Washington DC: American Geophysical Union, 205-228. [4] Berryman JG. 1980. Long-wavelength propagation in composite elastic media II. Ellipsoidal inclusions. The Journal of the Acoustical Society of America, 68(6), 1820–1831. doi: 10.1121/1.385172 [5] Collett TS. 1995. Gas hydrate resources of the United States. National assessment of United States oil and gas resources on CD-ROM: US Geological Survey Digital Data Series, 30(1), . [6] Carcione JM, Gei D, Rossi G, Madrussani G. 2005. Estimation of gas-hydrate concentration and free-gas saturation at the Norwegian-Svalbard continental margin. Geophysical Prospecting, 53(6), 803–810. doi: 10.1111/j.1365-2478.2005.00502.x [7] Domenico SN. 1976. Effect of brine-gas mixture on velocity in an unconsolidated sand reservoi. Geophysics, 41, 882–894. doi: 10.1190/1.1440670 [8] Dickens GR, Quinby HMS. 1994. Methane hydrate stability in seawater. Geophysical Research Letters, 21(19), 2115–2118. doi: 10.1029/94GL01858 [9] Dvokin J, Nur A, Yin H. 1994. Effective properties of cemented granular material. Mechanics of Materials, 18(4), 351–356. doi: 10.1016/0167-6636(94)90044-2 [10] Fang YX, Lu JA, Liang JQ, Kuang ZG, Cao YC, Chen DF. 2019. Numerical studies of gas hydrate evolution time in Shenhu area in the northern South China Sea. China Geology, 2, 49–55. doi: 10.31035/cg2018054 [11] Hamilton EL. 1980. Geoacoustic modeling of the sea floor. The Journal of the Acoustical Society of America, 68(5), 1313–1340. doi: 10.1121/1.385100 [12] Hornby BE, Schwartz LM, Hudson JA. 1994. Anisotropic effective medium modeling of the elastic properties of shales. Geophysics, 59(10), 1570–1583. doi: 10.1190/1.1443546 [13] Helgerud MB, Dvornik J, Nur A, Sakai A, Collett TS. 1999. Elastic-wave velocity in marine sediments with gas hydrates: Effective medium modeling. Geophysical Research Letter, 26(13), 2021–2024. doi: 10.1029/1999GL900421 [14] Holland M, Schultheiss P, Roberts J, Druce M. 2008. Observed gas hydrate morphologies in marine sediments. 6th International Conference on Gas Hydrates, Chevron, Vancouver, BC, Canada, 6-10. [15] He YY, Wang YM, Wang X, Hu LG, Jiang JQ. 2018. Miocene carbonate platforms in the northwest South China Sea and controlling factors. Marine Geology & Quaternary Geology, 38(6), 127–135 (in Chinese with English abstract). [16] Kvenvolden KA. 1993. Gas hydrates: Geological perspective and global change. Reviews of Geophysics, 31(2), 173–187. doi: 10.1029/93RG00268 [17] Lee MW, Collett TS. 1999. Amount of gas hydrate estimated from compressional-and shear-wave velocities at the JAPEX/JNOC/GSC Mallik 2L-38 gas hydrate research well. Bulletin- Geological Survey of Canada, 313–322. [18] Lee MW, Waite WF. 2008. Estimating pore-space gas hydrate saturations from well-log acoustic data. Geochemistry Geophysics Geosystems, 9(Q07008), 1–8. [19] Lee MW, Collett TS. 2011. In-situ gas hydrate saturations estimated from various well logs at Mount Elbert well, North Slope of Alaska. Marine and Petroleum Geology, 28, 439–449. doi: 10.1016/j.marpetgeo.2009.06.007 [20] Liang JQ, Fu SY, Chen F, Su PB, Shang JJ, Lu HF, Fang YX. 2017. Characteristics of methane seepage and gas hydrate reservoir in the northeastern slope of South China Sea. Natural Gas Geoscience, 28(5), 761–770. [21] Li JF, Ye JL, Qin XW, Qiu HJ, Wu NY, Lu HL, Lu C. 2018. The first offshore natural gas hydrate production test in South China Sea. China Geology, 1, 5–16. doi: 10.31035/cg2018003 [22] Miller JJ, Lee MW, von Huene R. 1991. An analysis of a seismic reflection from the base of a gas hydrate zone, offshore Peru (1). AAPG Bulletin, 75(5), 910–924. [23] Mavko G, Mukerji T, Dvorkin J. 2009. The rock physics handbook tools for seismic analysis of porous media. New York, Cambridge University Press. [24] Ma GZ, Lu HL, Lu JA, Hou GT, Gong YH. 2020. Polygonal fault in marine sediments and its impact on gas hydrate occurrence. Geology in China, 47(1), 1–13 (in Chinese with English abstract). [25] Ojha M, Sain K. 2007. Seismic velocities and quantification of gas-hydrates from AVA modeling in the western continental margin of India. Marine Geophysical Researches, 28(2), 101–107. doi: 10.1007/s11001-007-9017-6 [26] Qin XW, Zhao B, Li FY, Zhang BJ, Wang HJ, Zhang RW, He JX, Chen X. 2019. Deep structural research of the South China Sea: Progresses and directions. China Geology, 2, 530–540. [27] Su PB, Liang JQ, Zhang ZJ, Sha ZB. 2017. Analysis on the bring spots and dim out of seismic section for diffusion-type hydrate in Shenhu area. Earth Science Frontiers, 24(4), 051–056 (in Chinese with English abstract). [28] Wood WT, Stoffa PL, Shipley TH. 1994. Quantitative detection of methane hydrate through high-resolution seismic velocity analysis. Journal of Geophysical Research: Solid Earth, 99(B5), 9681–9695. doi: 10.1029/94JB00238 [29] Waite WF, Helgerud M B, Nur A, Pinkston JC, Stern LA, Kirby SH, Durham WB. 2000. Laboratory measurements of compressional and shear wave speeds through methane hydrate, in GD Holder and PR Bishnoi (eds.), Gas hydrates: Challenges for the future. Annals of the New York Academy of Science 912, 1003-1010. [30] Wang Z. 2012. Fundamentals of seismic rock physics. Geophysics, 66(2), 398–412. [31] Wu SG, Zhu WL, Ma YS. 2018. Vicissitude of Cenozoic carbonate platforms in the South China Sea: Sedimentation in semi-closed marginal seas. Marine Geology & Quaternary Geology, 2018, 38(6), 1–17 (in Chinese with English abstract). [32] Yang Z, Wu SG, Lv FL, Wang DW, Wang B, Lu YT. 2014. Evolutionary model and control factors of Late Cenozoic carbonate platform in Xisha area. Marine Geology & Quaternary Geology, 2014, 34(5), 47–55 (in Chinese with English abstract). [33] Yang SX, Liang JQ, Lu JQ, Qu CW, Liu B. 2017. New understanding and characteristics and controlling factors of gas hydrate reservoirss in the Shenhu area on the northern slope of the South China Sea. Earth Science Frontiers, 24(4), 001–014 (in Chinese with English abstract). [34] Ye JL, Qin XW, Qiu HJ, Liang QY, Dong YF, Wei JG, Lu HL, Lu JA, Shi YH, Zhong C, Xia Z. 2018. Preliminary results of environmental monitoring of the natural gas hydrate production test in the South China Sea. China Geology, 1, 202–209. doi: 10.31035/cg2018029 [35] Zhu WL, Wang ZF, Mi LJ, Du XB, Xie XN, Lu YC, Zhang DJ, Sun ZP, Liu XY, You L. 2015. Sequence stratigraphic framework and reef growth unit of Well Xike-1 from Xisha Islands, South China Sea. Earth Science-Journal of China University of Geosciences, 40(04), 677–687 (in Chinese with English abstract). doi: 10.3799/dqkx.2015.055 [36] Zhao XW, Xu H. 2016. Sedimentary composition and forming models of Miocene reef carbonate: A case study of Xisha waters. Science & Technology Review, 34(18), 194–202 (in Chinese with English abstract). [37] Zhang W, Liang JQ, Lu JA, Wei JG, Su PB, Fang YX, Zhang G. 2017. Accumulation features and mechanisms of high saturation natural gas hydrate in Shenhu Area, northern South China Sea. Petroleum Exploration and Development, 44(5), 708–719. doi: 10.1016/S1876-3804(17)30082-4 [38] Zhang RW, Lu JA, Wen PF, Kuang ZG, Zhang BJ, Xue H, Xu YX, Chen X. 2018. Distribution of gas hydrate reservoir in the first production test region of the Shenhu area, South China Sea. China Geology, 1, 493–504. doi: 10.31035/cg2018049 [39] Zhang W, Liang JQ, SU PB, Wang LF, Lin L, Huang W, Wei JG, Liang J. 2020. Research progress and prospect of relationship between double bottom simulating reflector and the accumulation of gas hydrates. Geology in China, 47(1), 29–42 (in Chinese with English abstract). -
Access History

Figures(17)
Tables(1)

Export File
Citation
Jin-qiang Liang, Wei Deng, Jing-an Lu, Zeng-gui Kuang, Yu-lin He, Wei Zhang, Yue-hua Gong, Jin Liang, Miao-miao Meng, 2020. A fast identification method based on the typical geophysical differences between submarine shallow carbonates and hydrate bearing sediments in the northern South China Sea, China Geology, 3, 16-27. doi: 10.31035/cg2020021
Format
Content
 DownLoad:


-
Figure 1.
a–Location of the study areas; b–submarine landform map of SH area; c–submarine landform map of XS area.
-
Figure 2.
Typical BSRs in the SH on the post-stack seismic profile. The arrows indicates the BSRs. The seafloor owns positive reflection with red color. BSRs are displayed with black. Gas blanking and low-frequency anomaly below the BSRs are obvious, indicating gas migrating pathways.
-
Figure 3.
Typical BSRs of thin hydrate reservoir in the SH on the post-stack seismic profile. The arrows indicates the BSRs. W18 drilled through the BSR and thin layer of hydrates were found. Hydrate top and BSR are in the same half wavelength.
-
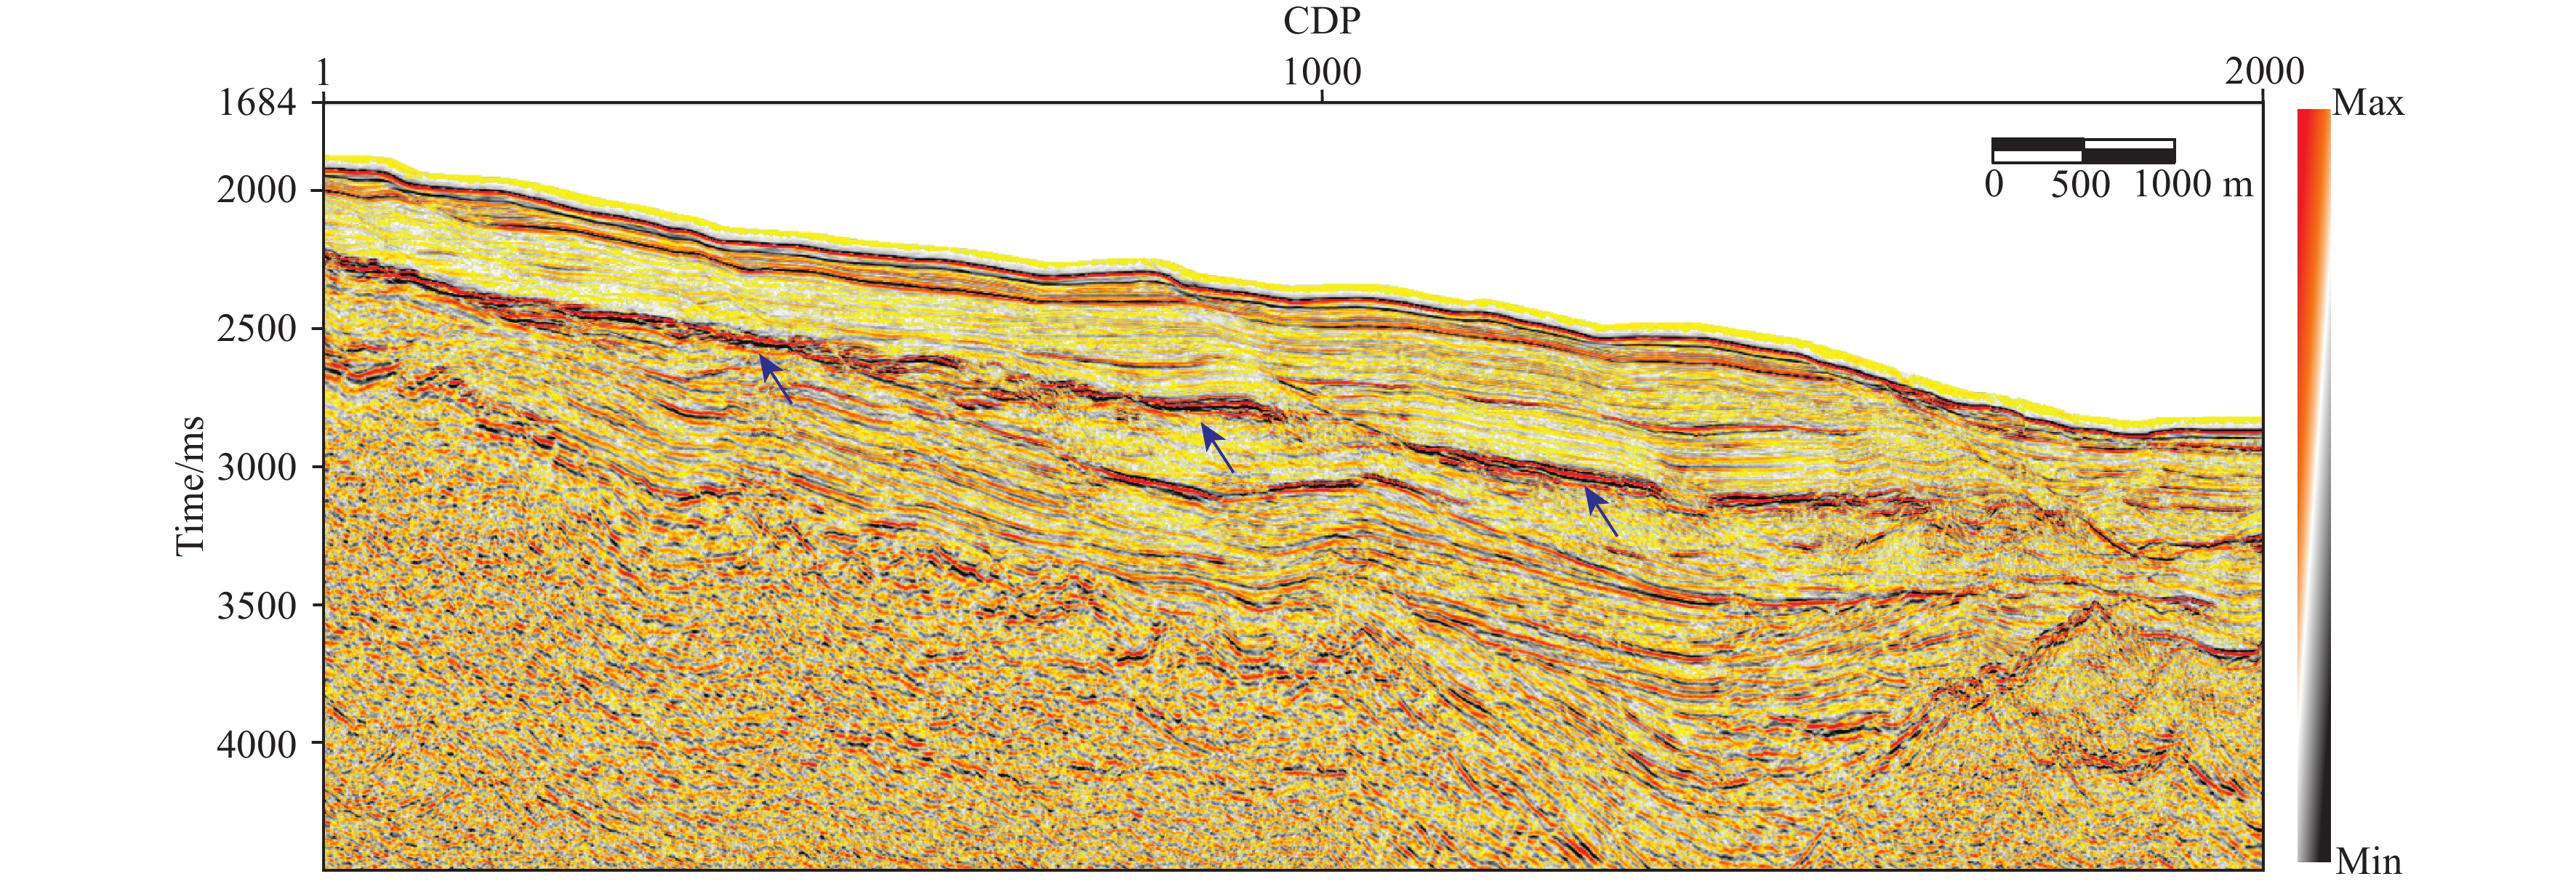
Figure 4.
Typical seismic section of carbonate rocks in the XS. The arrows indicate the bottom of carbonate layers.
-
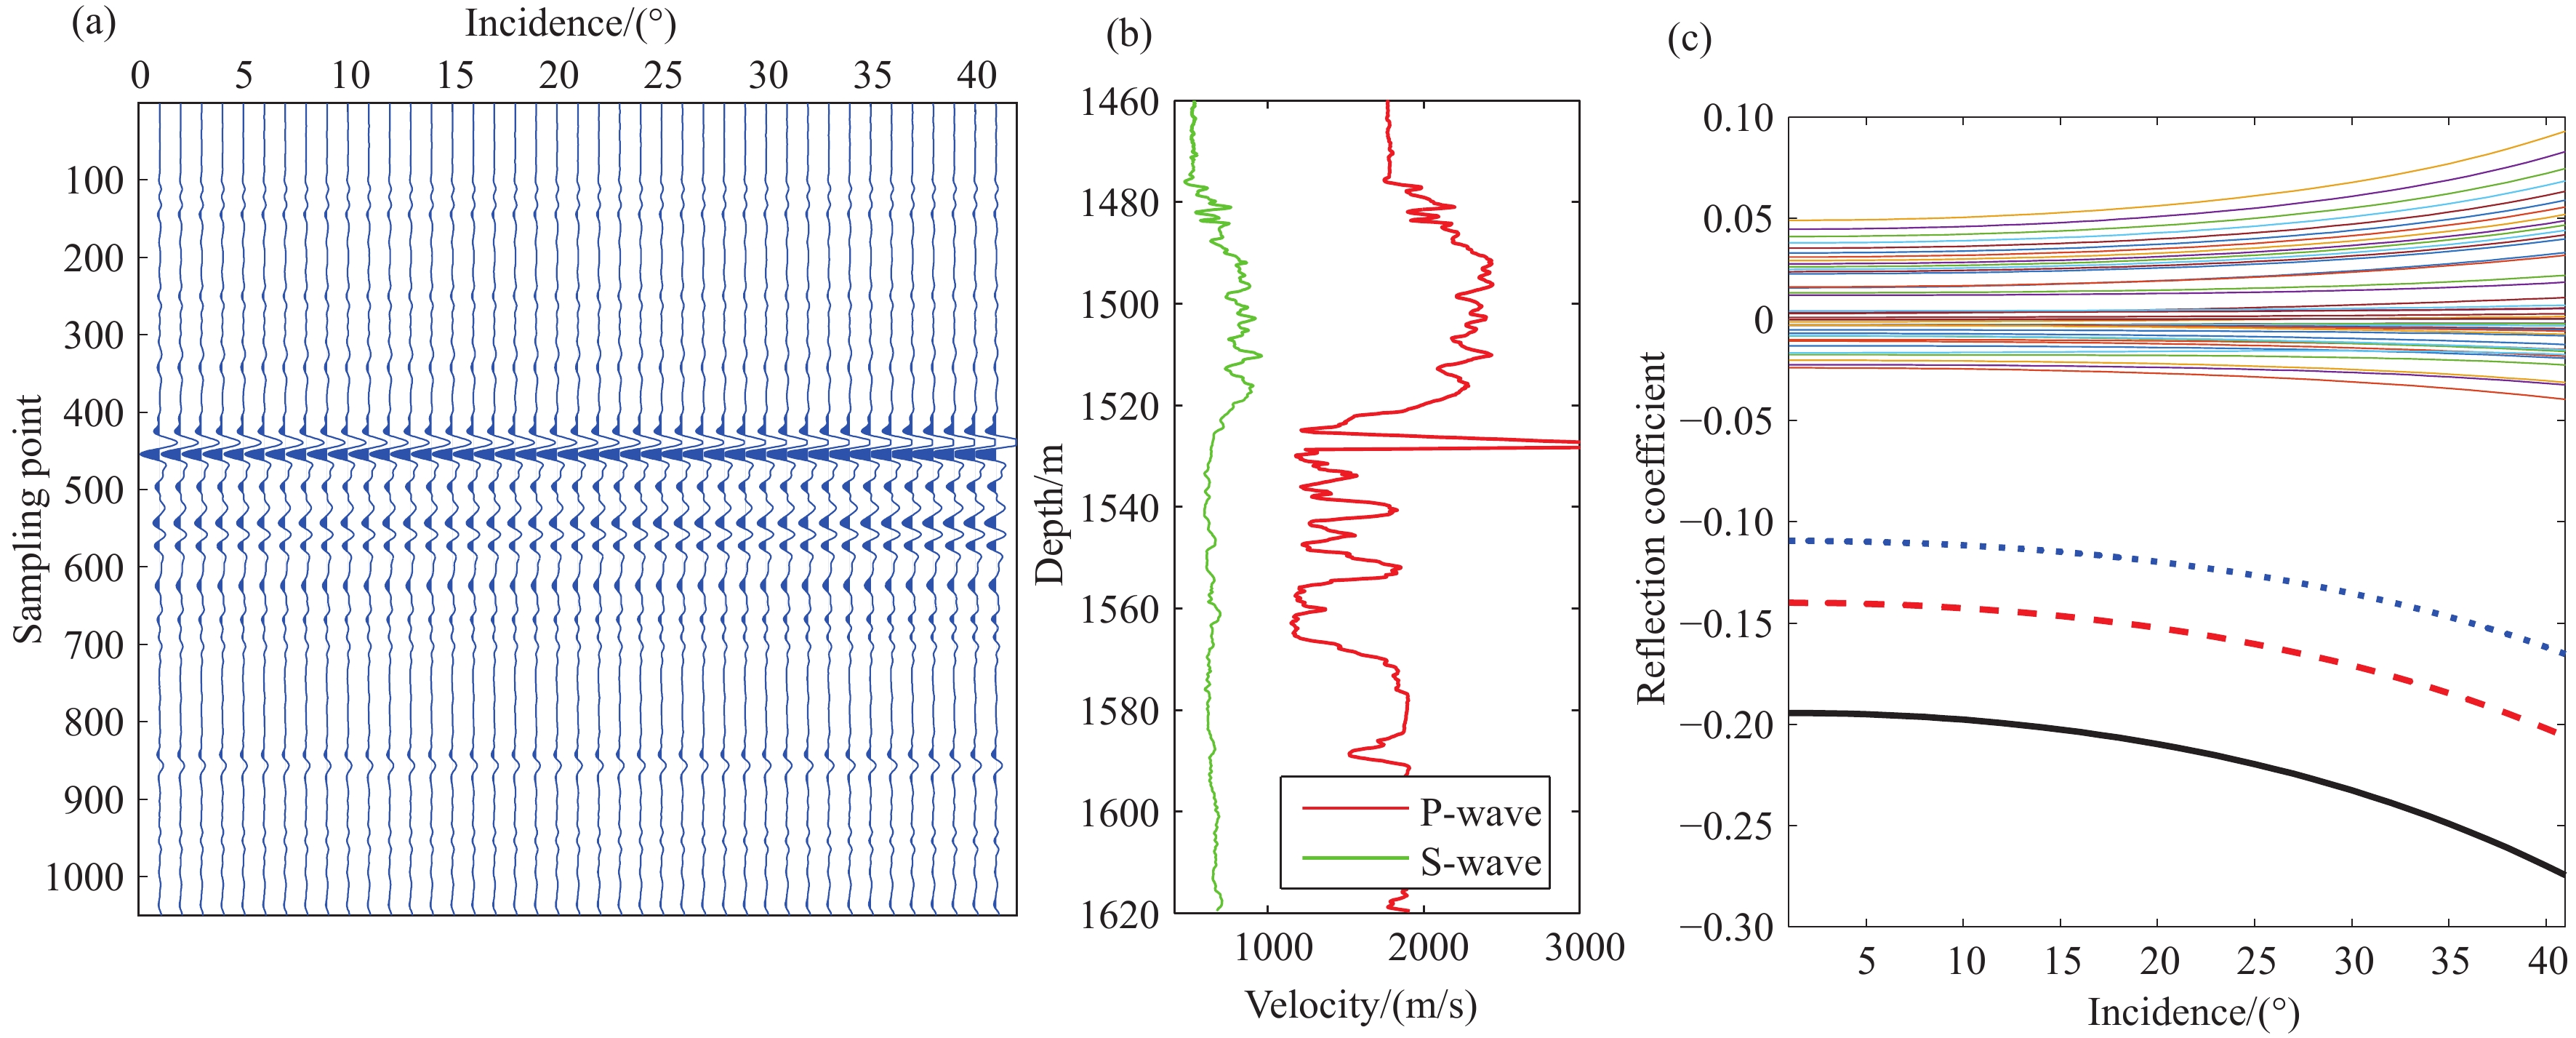
Figure 5.
AVO forward modeling in XH1. a–synthetic traces at different incidence; b–P-wave velocity and S-wave velocity logs; c–reflection coefficient versus incidence at different depths in the carbonate layers. The curves with different colors refer to the coefficients at different depths. The red dashed line refers to the AVO curve at the top of the carbonate layer. The blue curve refers to the AVO curve in the carbonate layer. The black curve refers to the AVO curve of the carbonate bottom.
-
Figure 6.
AVO forward modeling in XH2. a–synthetic traces at different incidence; b–P-wave velocity and S-wave velocity logs; c–reflection coefficient versus incidence at different depths in the carbonate layers. The curves with different colors refer to the coefficients at different depths. The red dashed line refers to the AVO curve at the top of the carbonate layer. The blue curve refers to the AVO curve in the carbonate layer. The black curve refers to the AVO curve of the carbonate bottom.
-
Figure 7.
AVO forward modeling in SH1. a–synthetic traces at different incidence; b–P-wave velocity and S-wave velocity logs; c–reflection coefficient versus incidence at different depths in the hydrate layers. The curves with different colors refer to the coefficients at different depths. The red dashed line refers to the AVO curve of BSR. The blue curve refers to the AVO curve of gas top at 1540 m below the BSR. The black curve refers to the AVO curve at 1530 m.
-
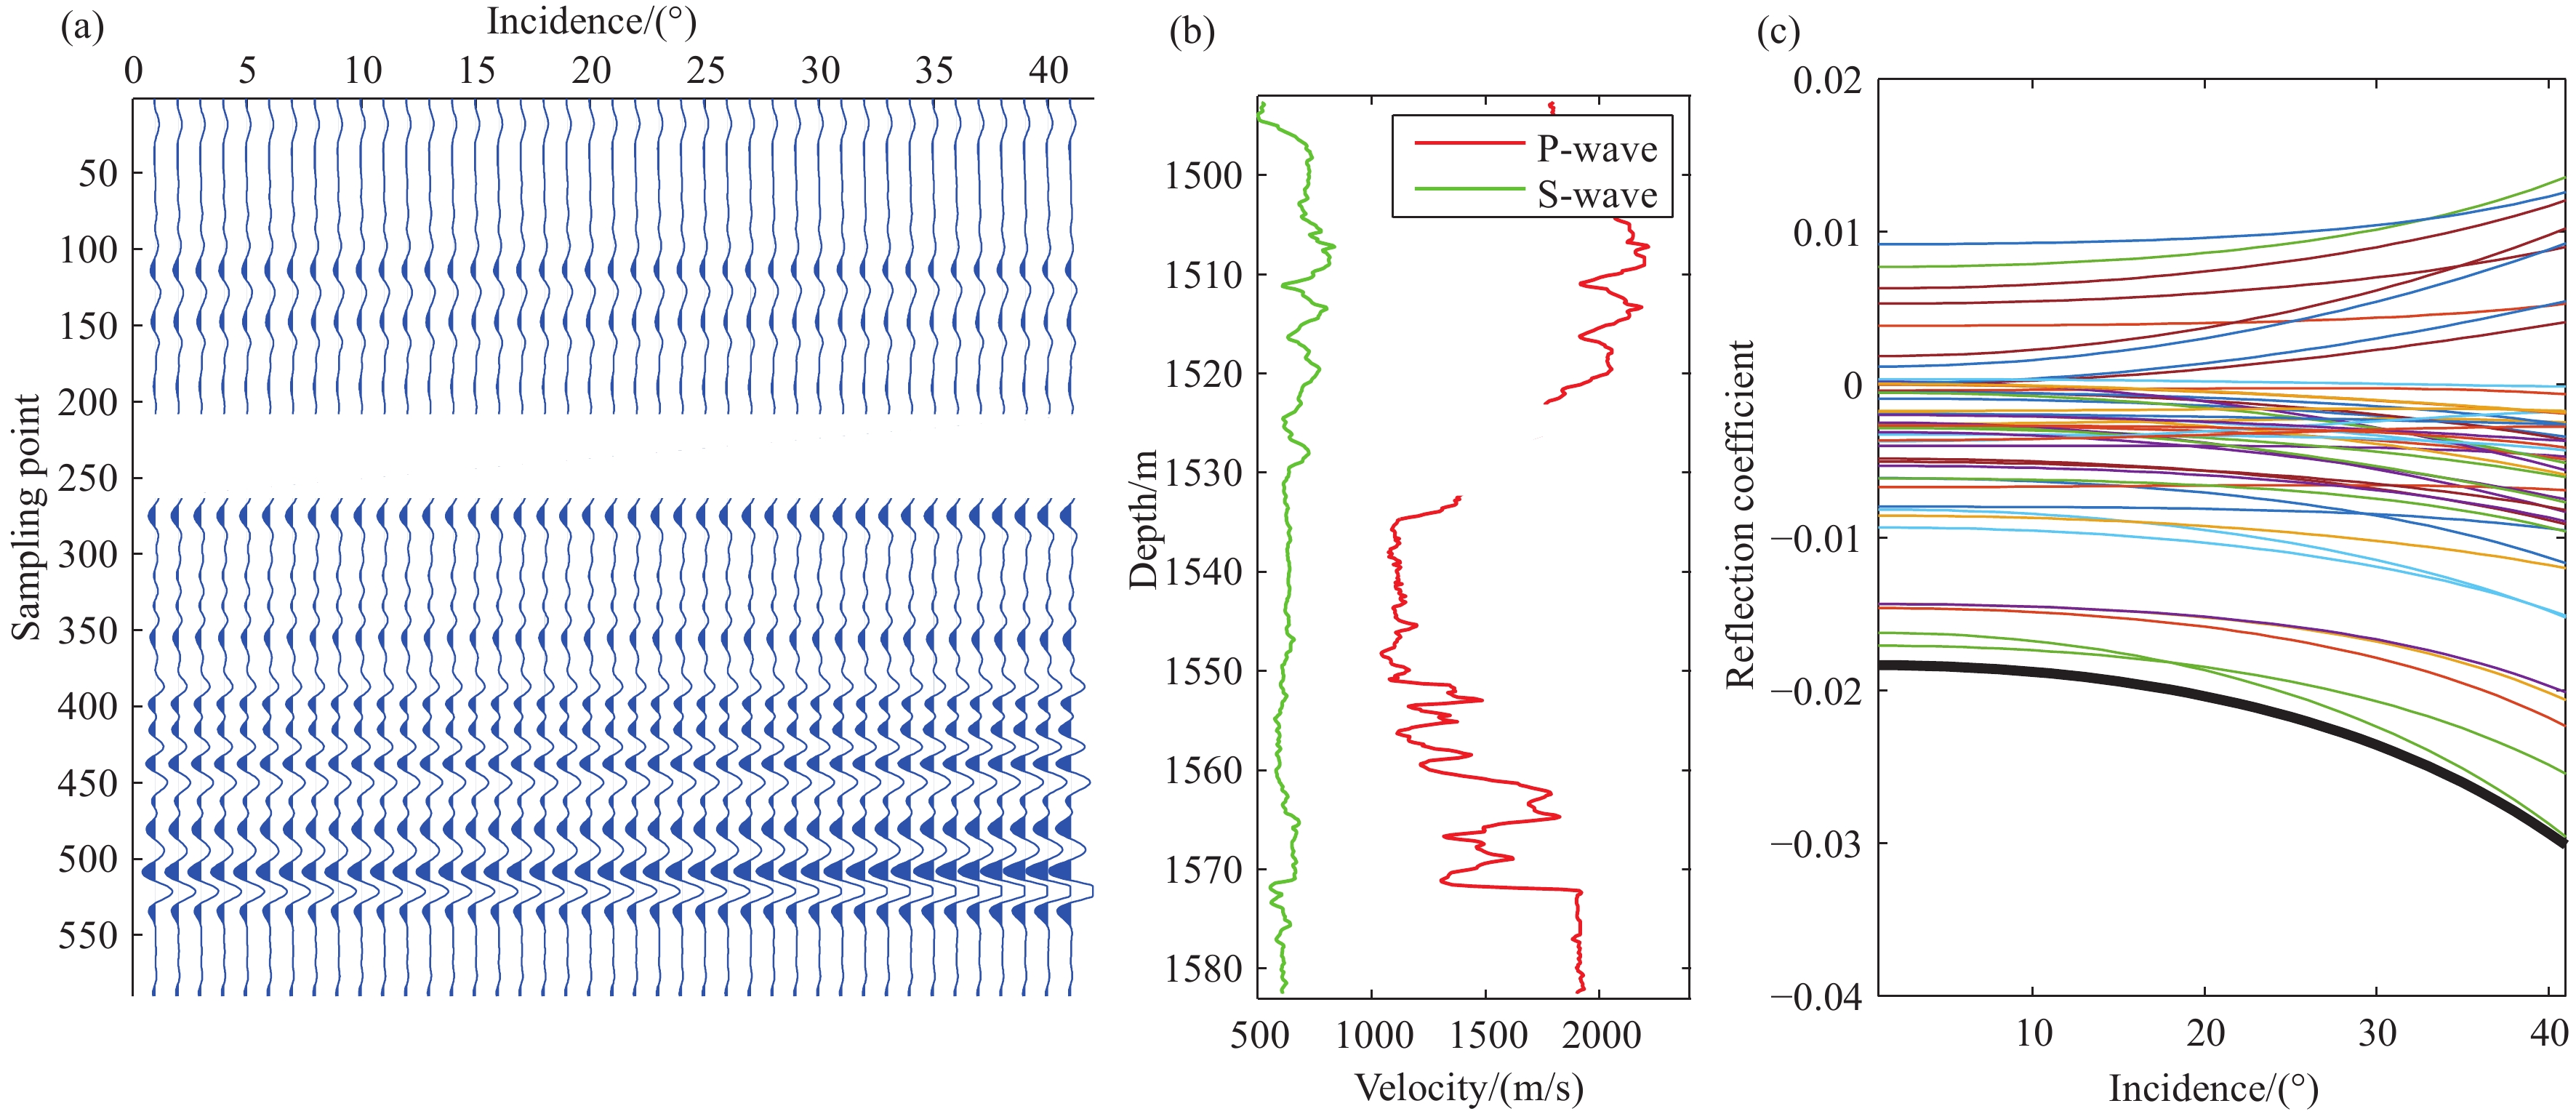
Figure 8.
AVO forward modeling in SH2. a–synthetic traces at different incidence; b–P-wave velocity and S-wave velocity logs; c–reflection coefficient versus incidence at different depths in the hydrate layers. The curves with different colors refer to the coefficients at different depths. The black bold curve refers to the AVO curve of the BSR.
-
Figure 9.
Cross-plot of velocity and porosity in the SH when there is no hydrate and free gas.
-
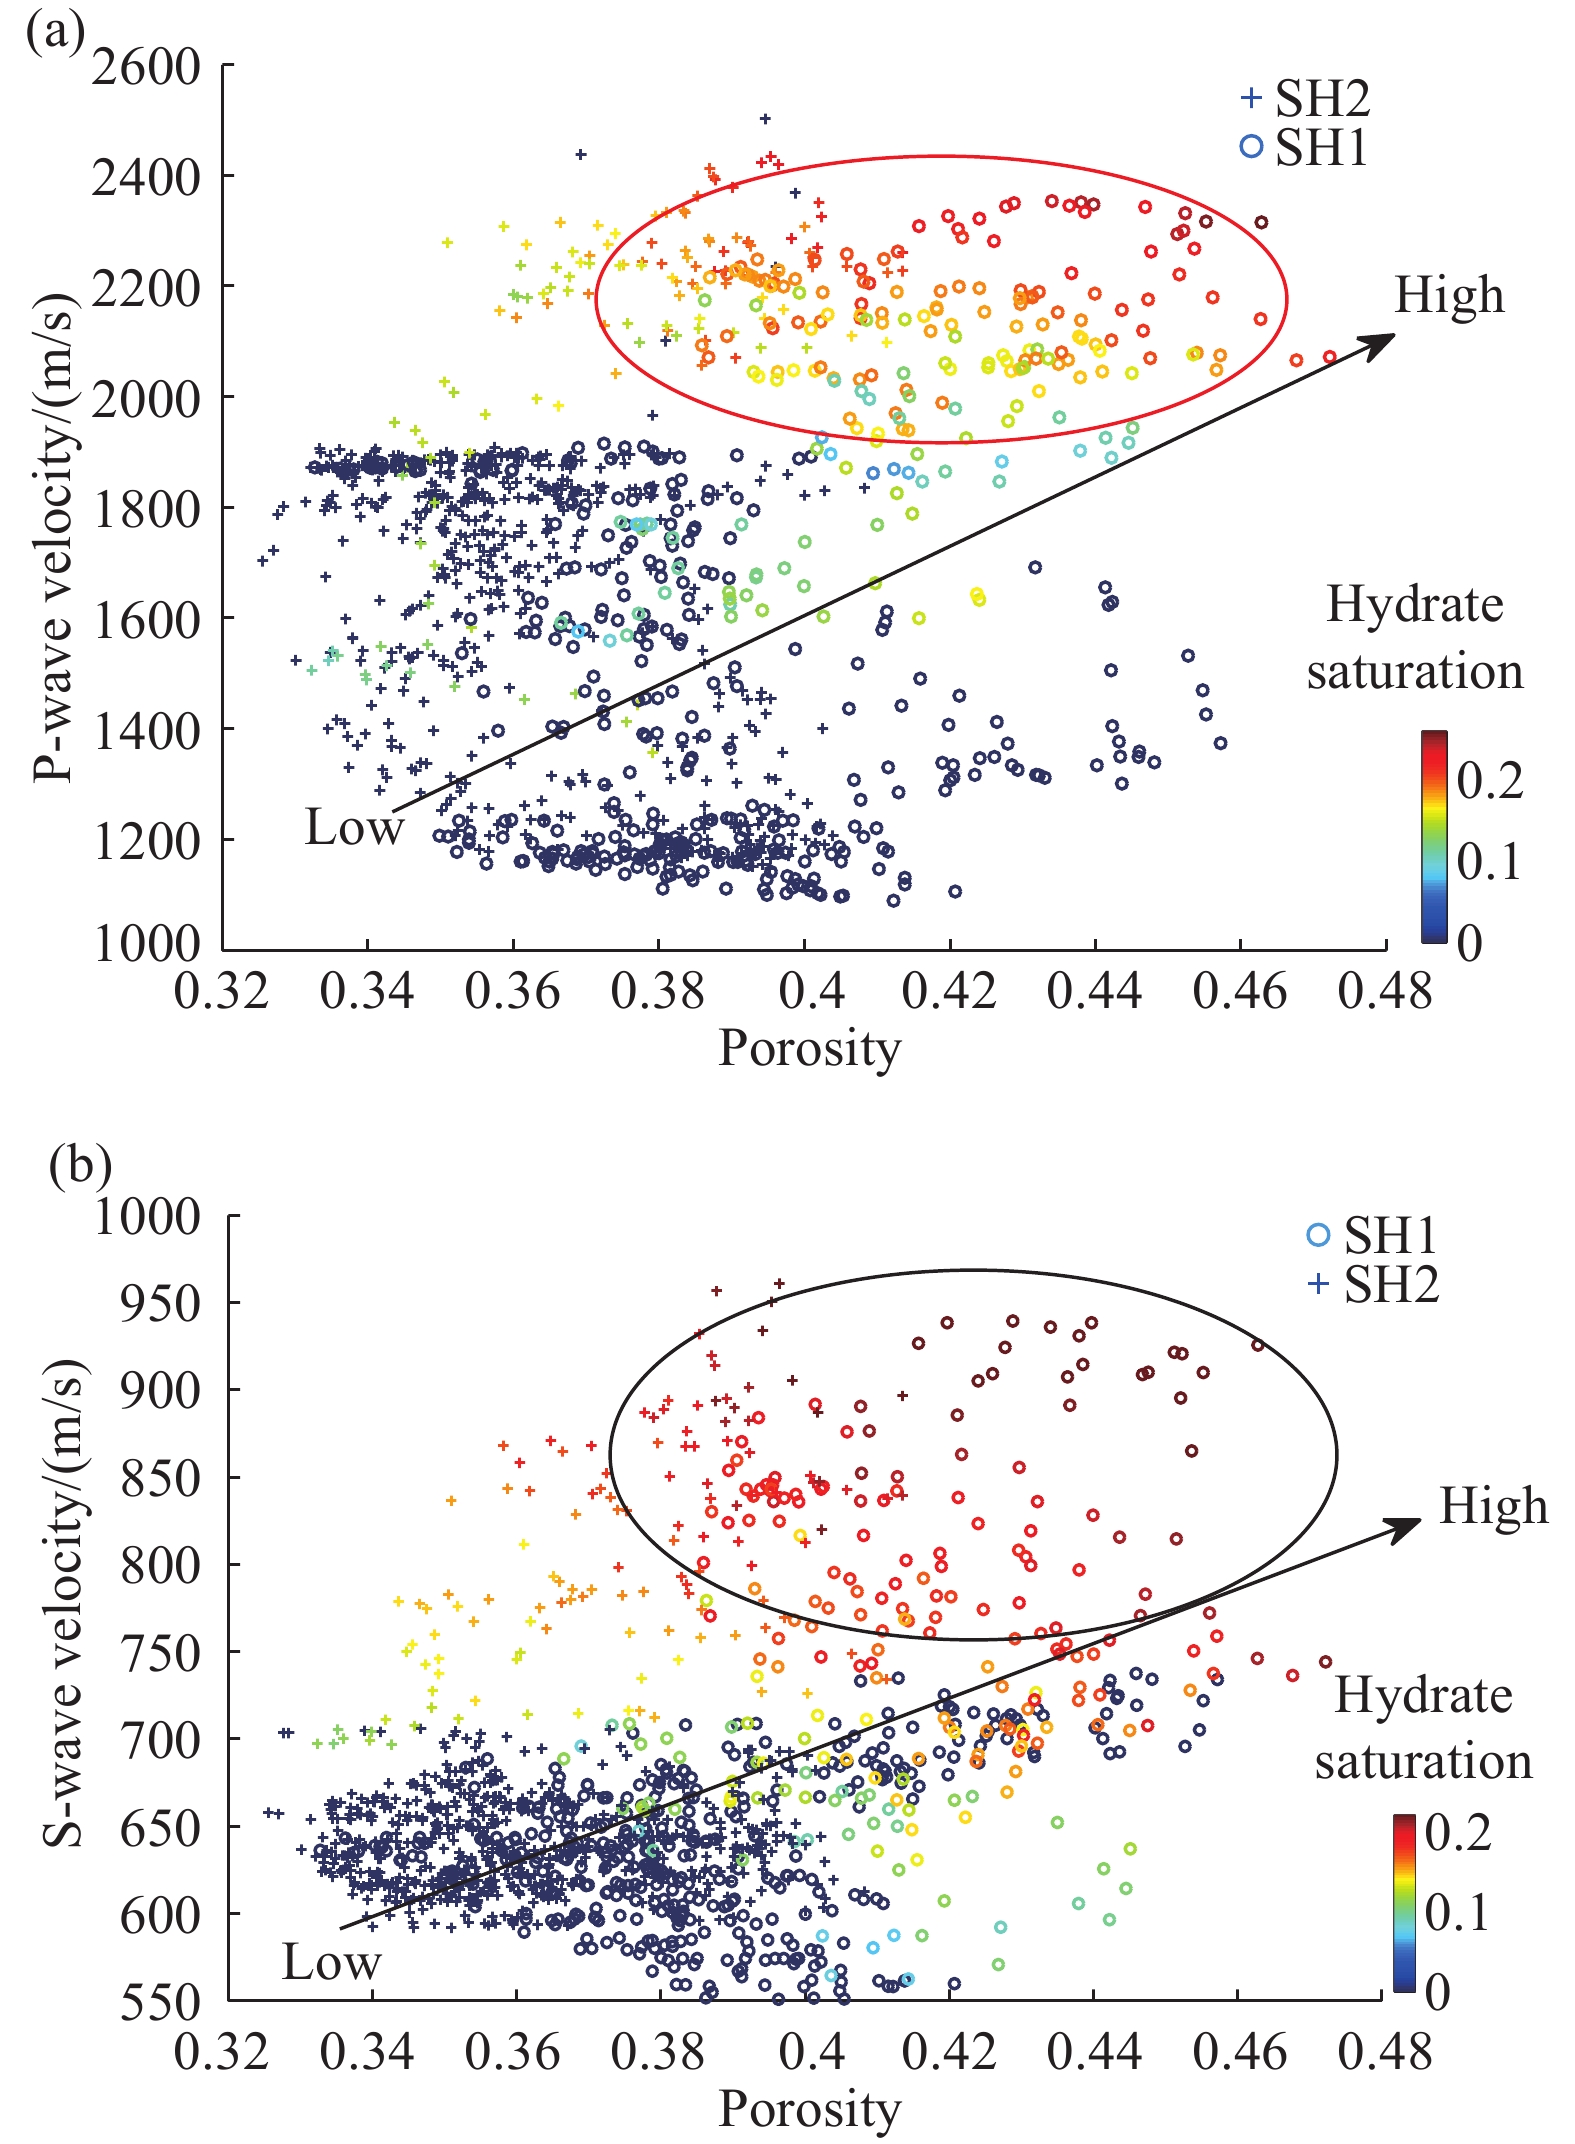
Figure 10.
Cross-plots of velocity and porosity in hydrate and gas reservoirs in the SH. The color axis is hydrate saturation calculated by resistivity. a–cross-plot of P-wave velocity and porosity; b–cross-plot of S-wave velocity and porosity.
-
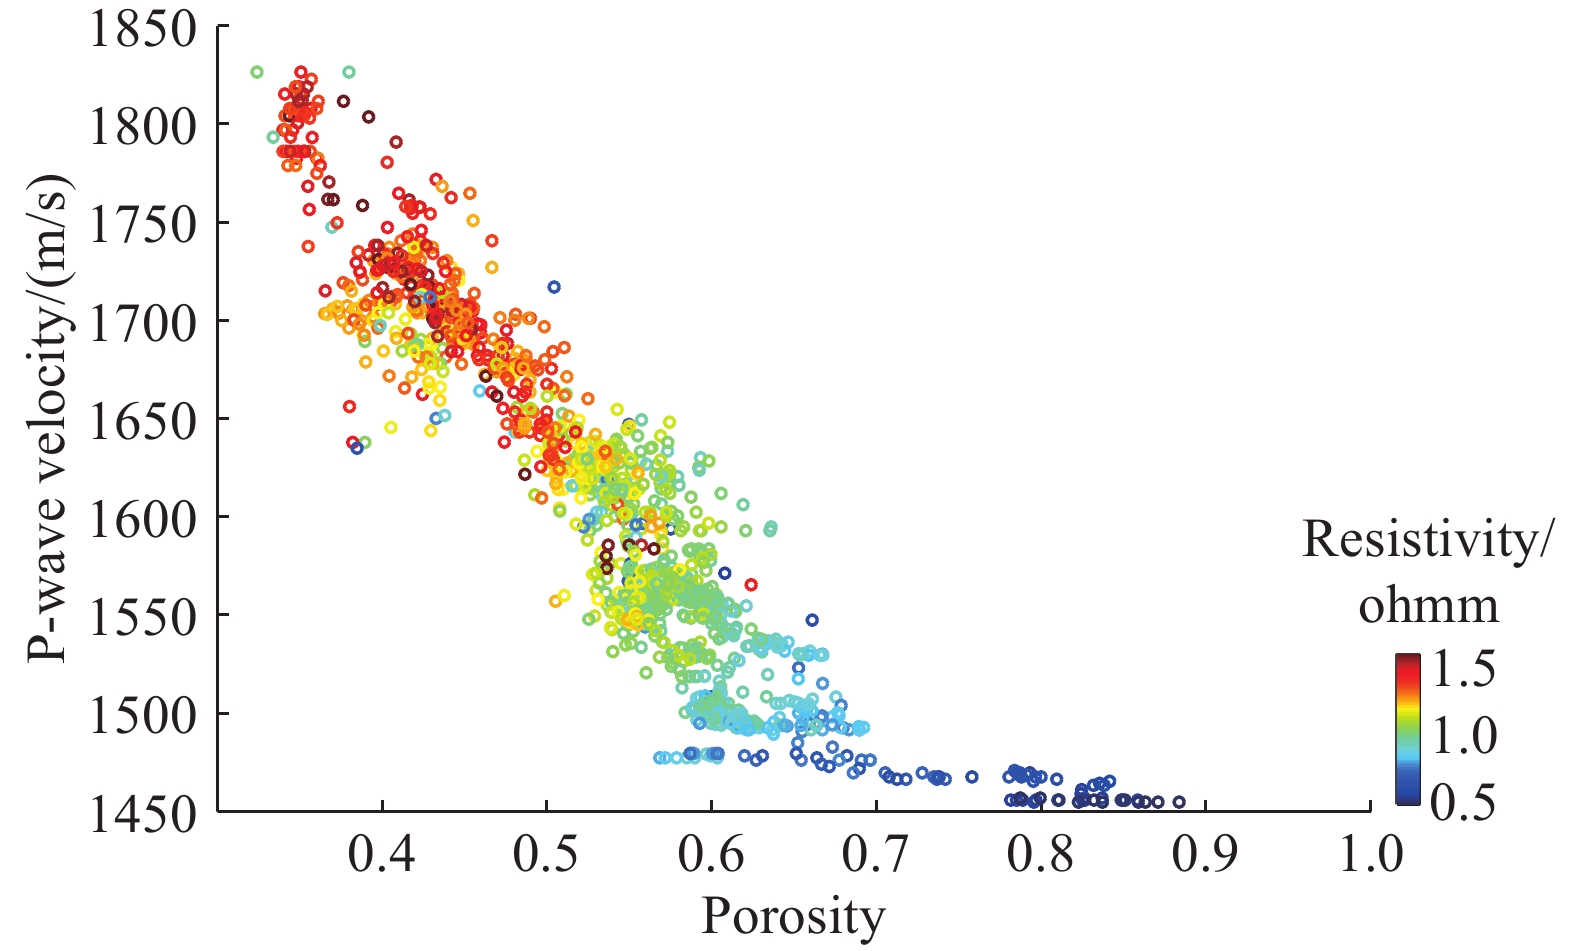
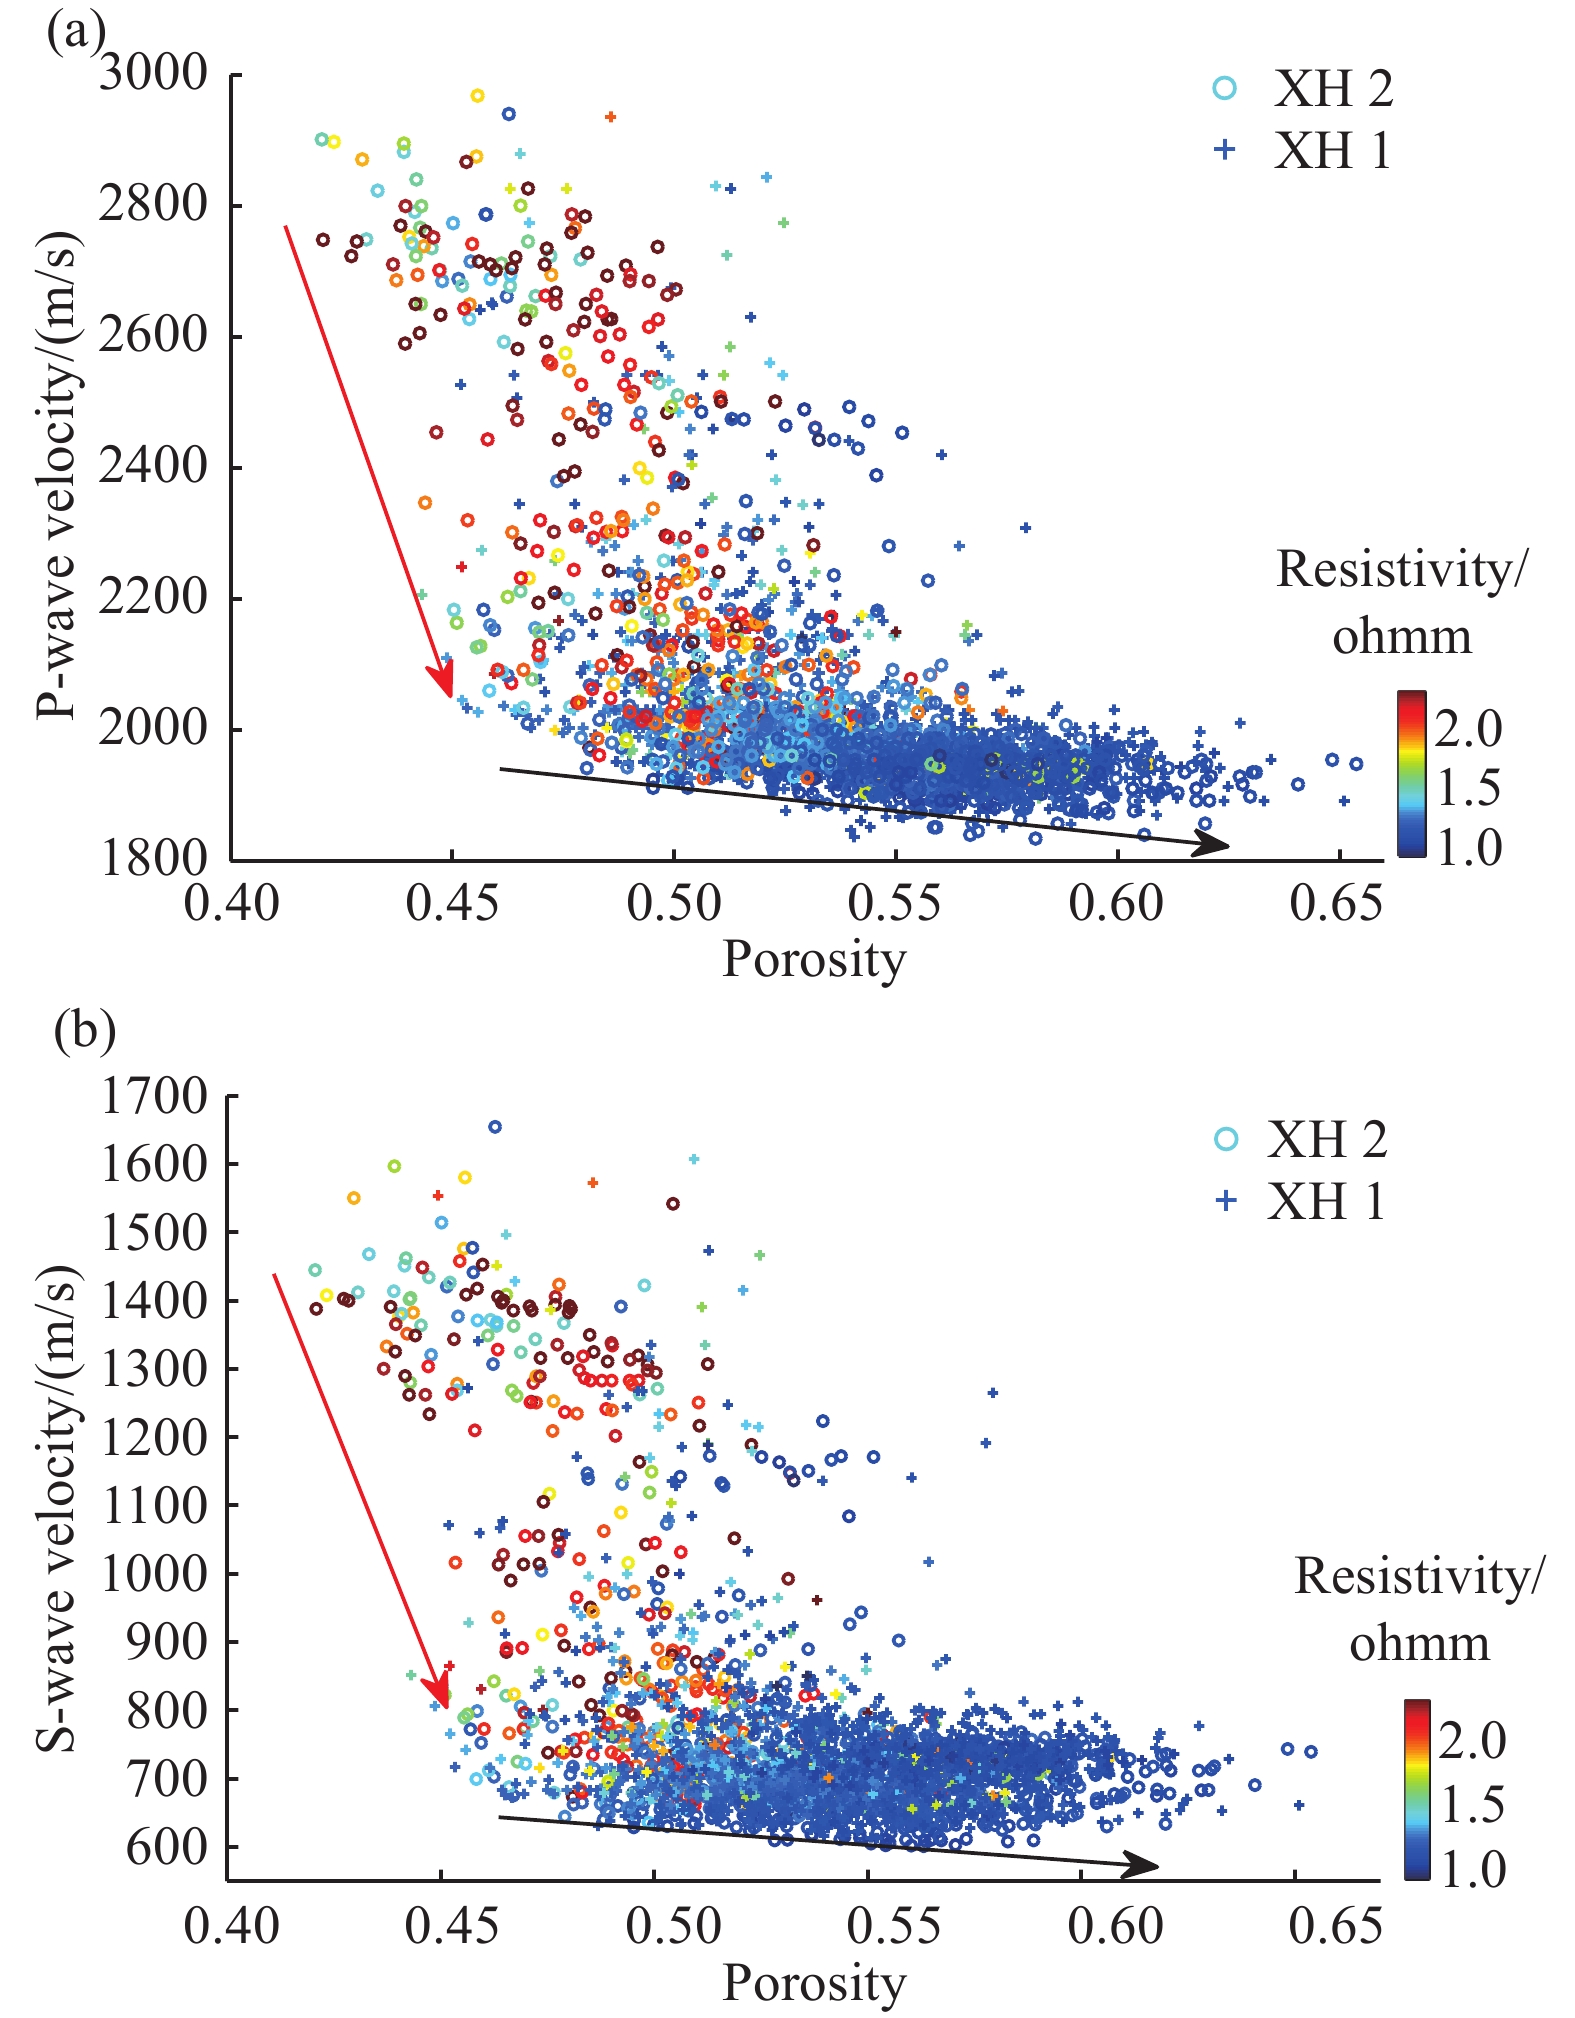
Figure 11.
Cross-plots of velocity and porosity in carbonate layers in the XS. The color axis is resistivity. a–cross-plot of P-wave velocity and porosity; b–cross-plot of S-wave velocity and porosity.
-
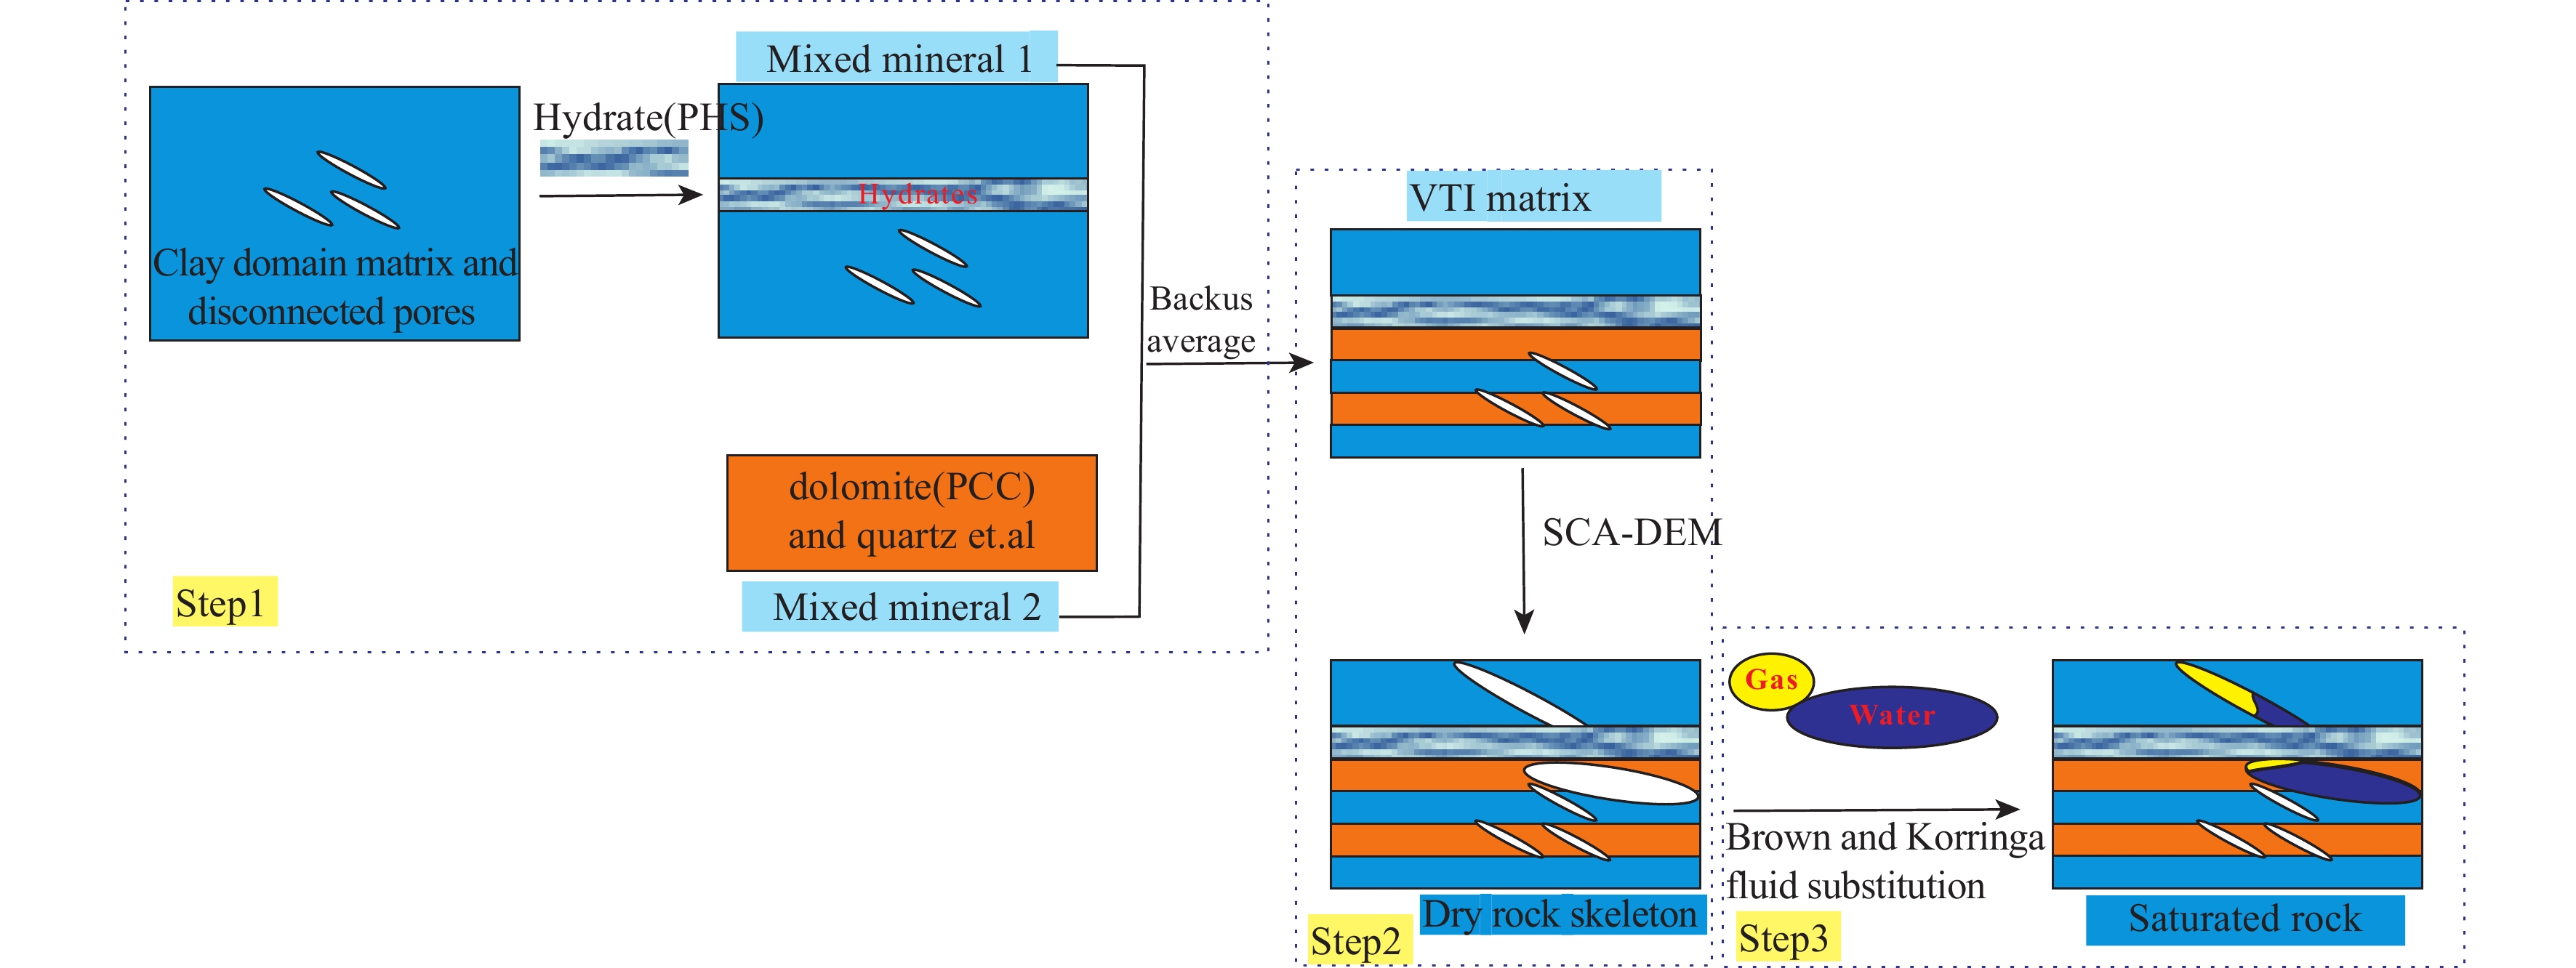
Figure 12.
Flow chart of two-phase hybrid modeling.
-
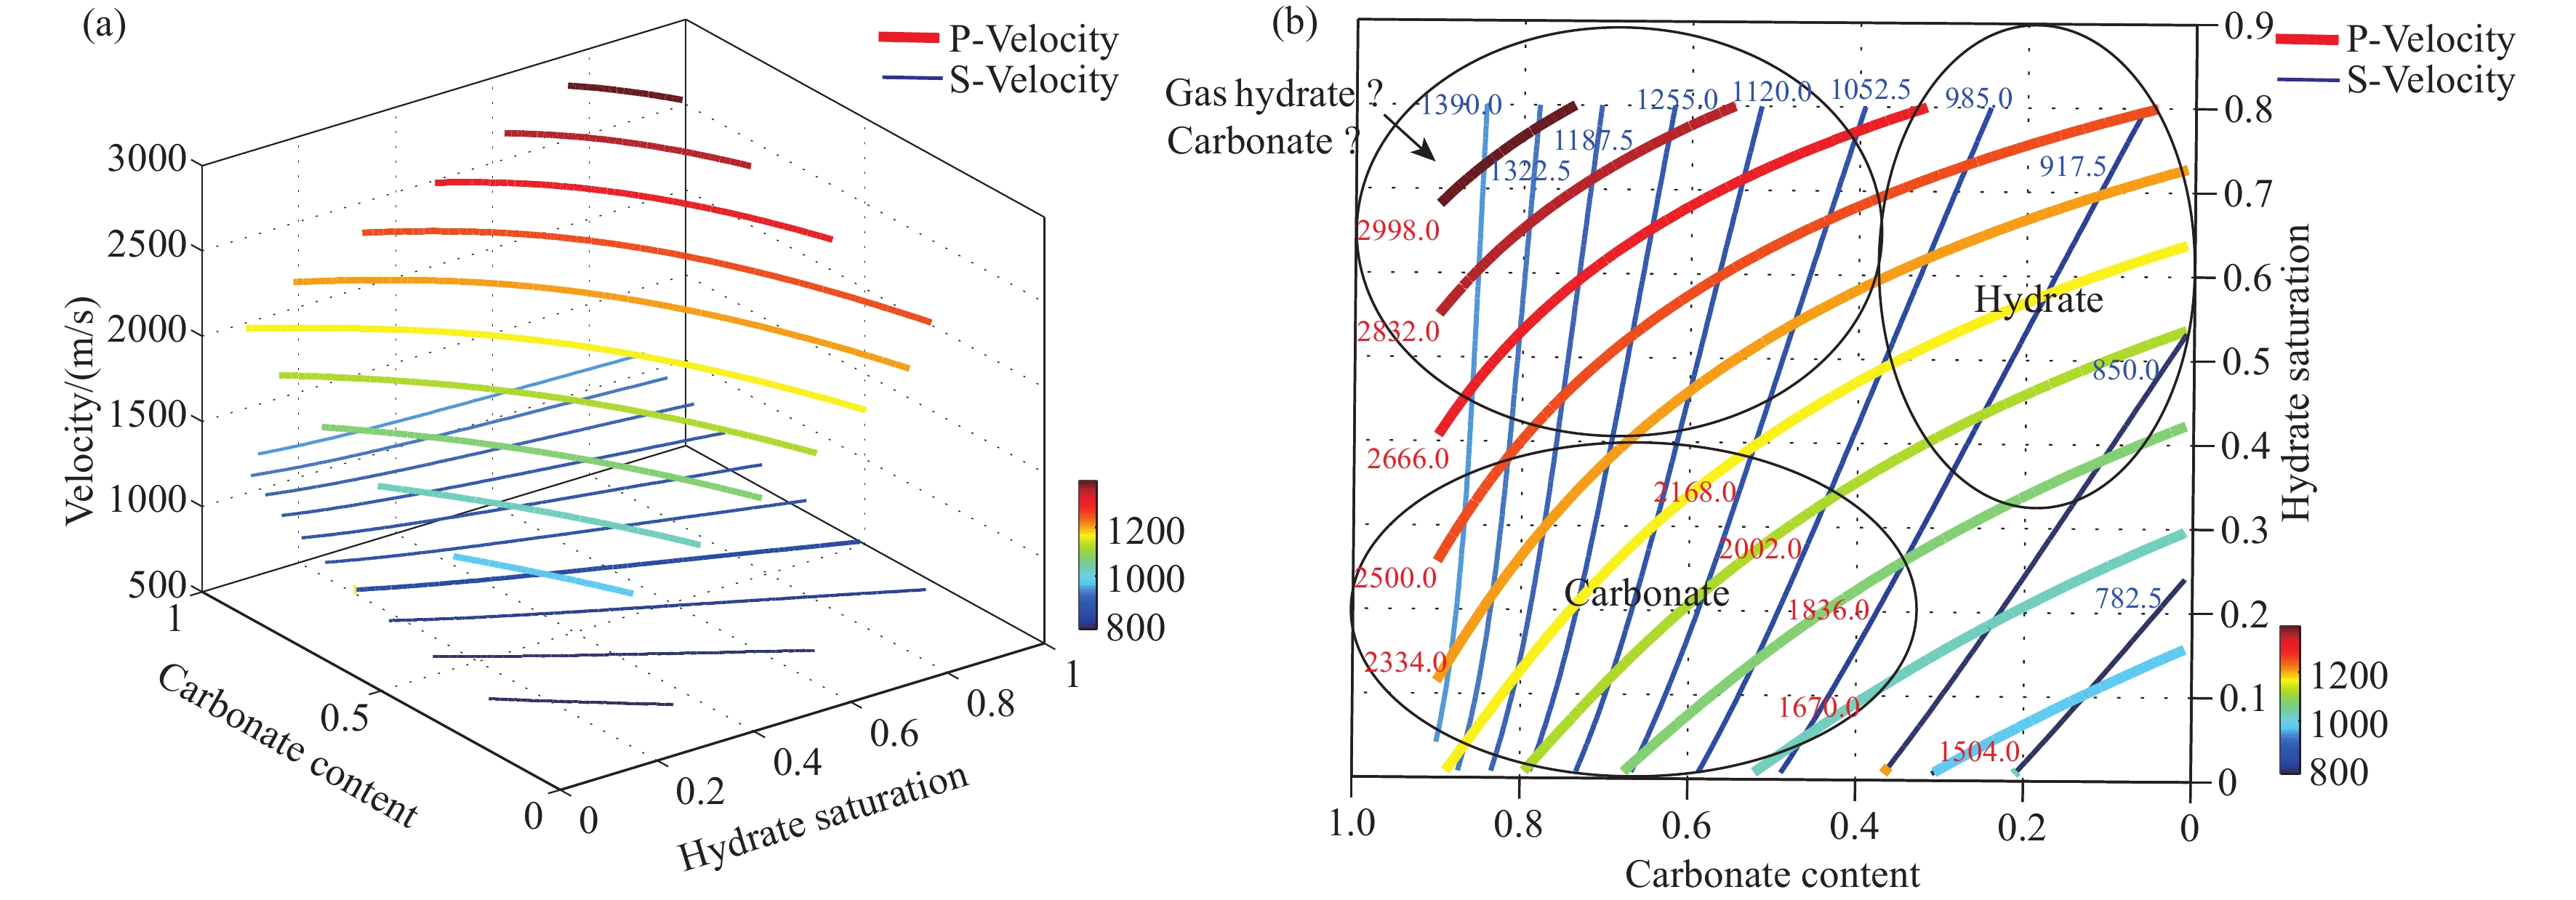
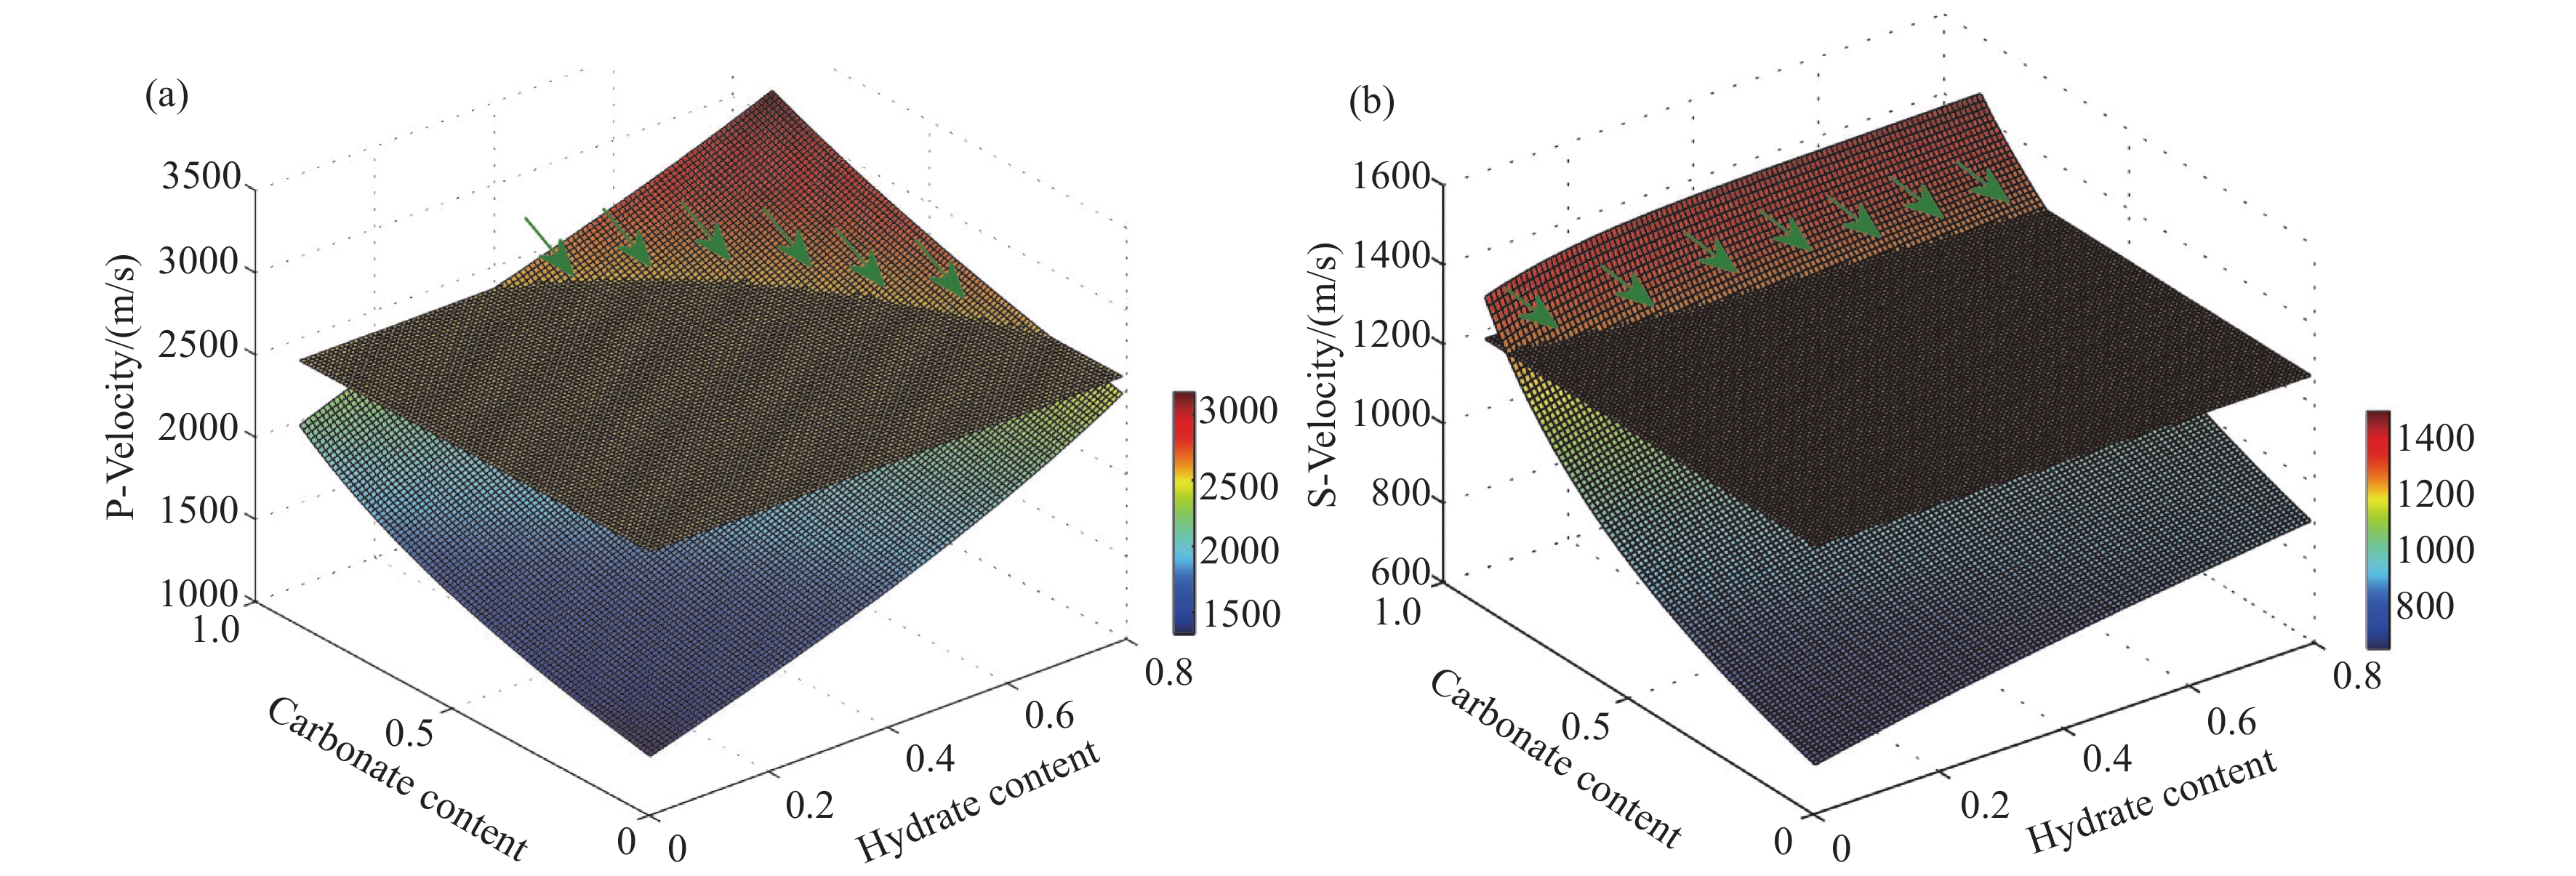
Figure 13.
P-velocity and S-velocity plots with different PHS and PCC combinations; a–P-velocity and S-velocity contours with different PHS and PCC combinations; b–planar graph of P-velocity and S-velocity in PHS-PCC coordinates.
-
Figure 14.
PCC-PHS curve corresponding to a carbonate samples; a–PCC-PHS curve in the P-velocity cube; b–PCC-PHS curve in the S-velocity cube.
-
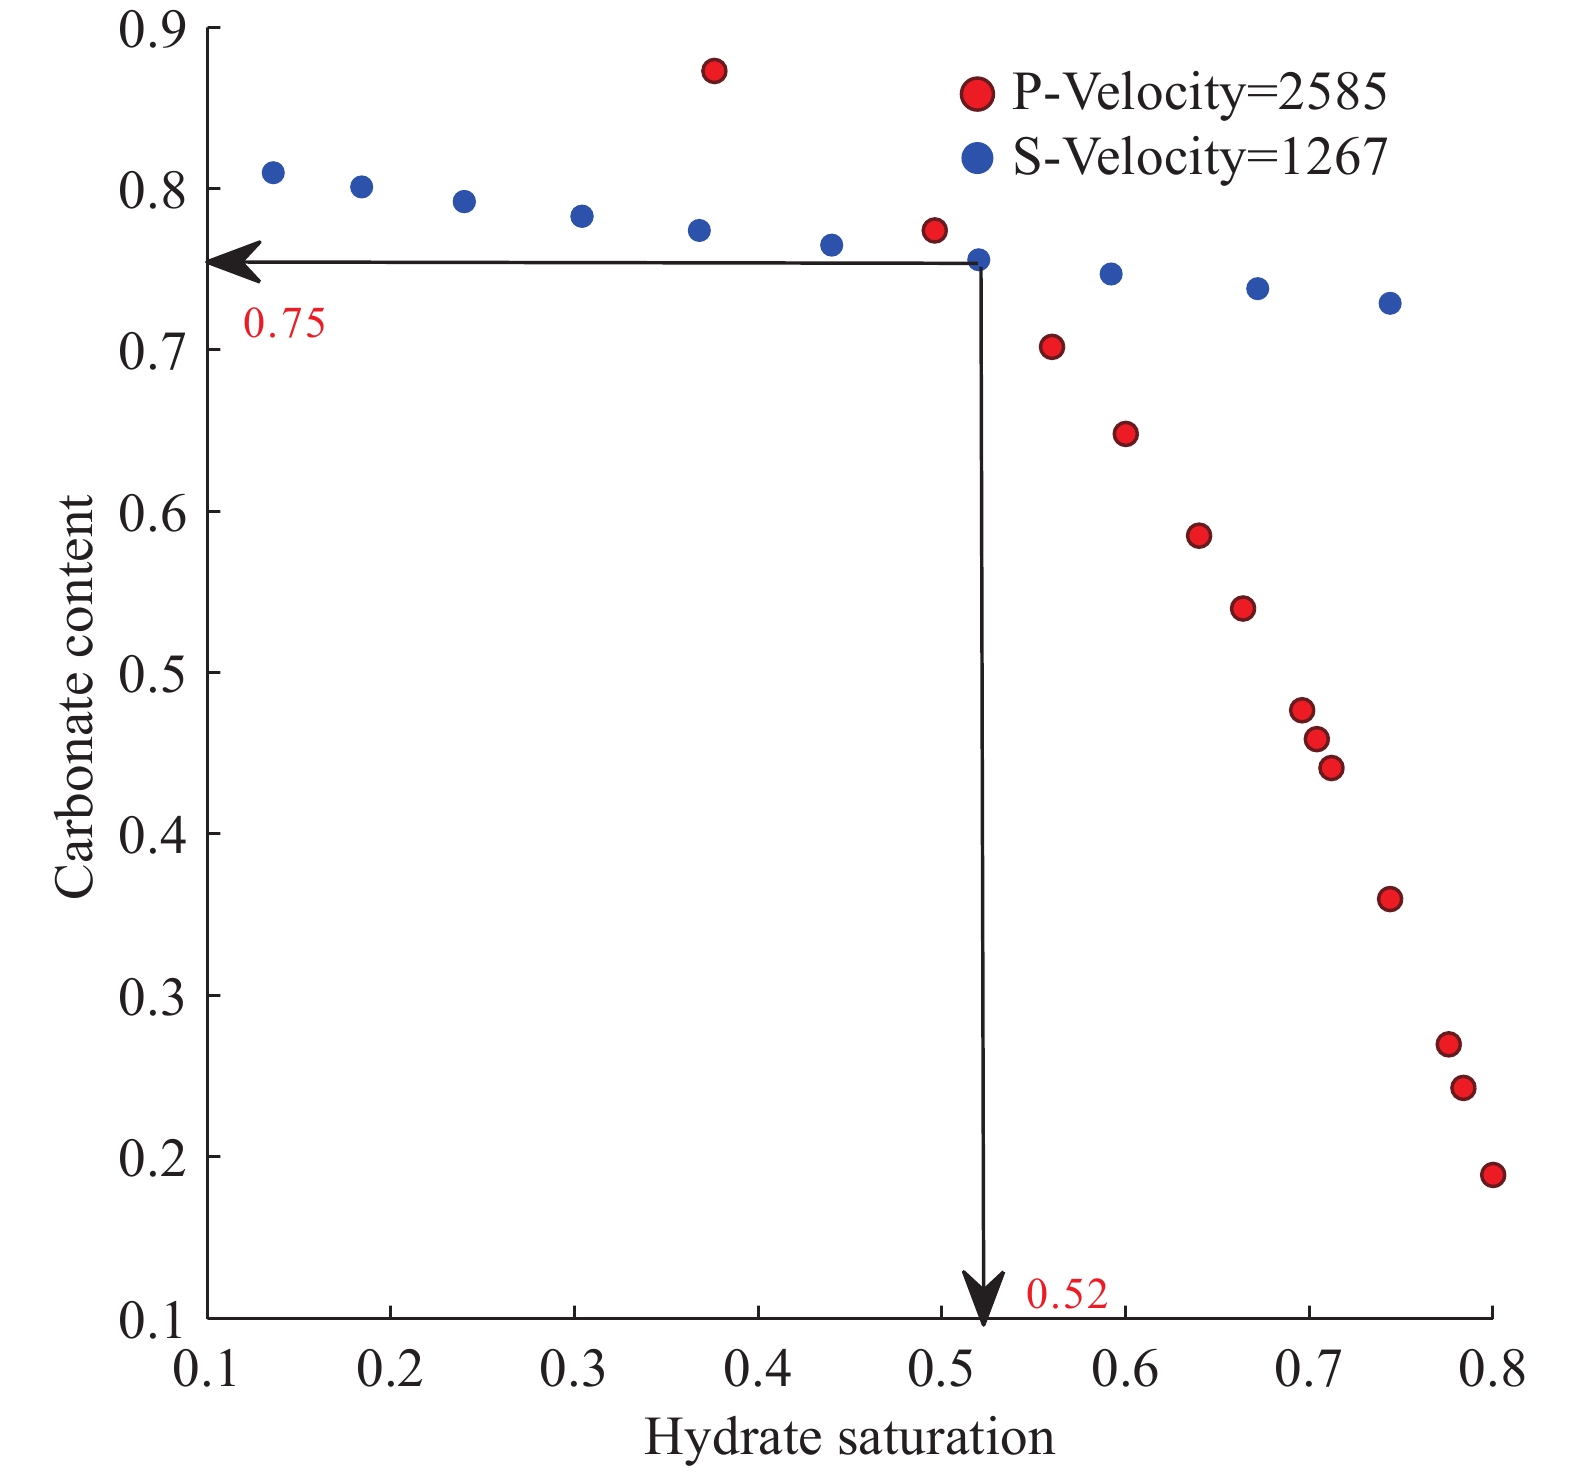
Figure 15.
PCC-PHS curves and their intersections. Red dots refer to the P-velocity contour of 2585 m/s. Blue dots refer to the S-velocity contour of 1267 m/s.
-
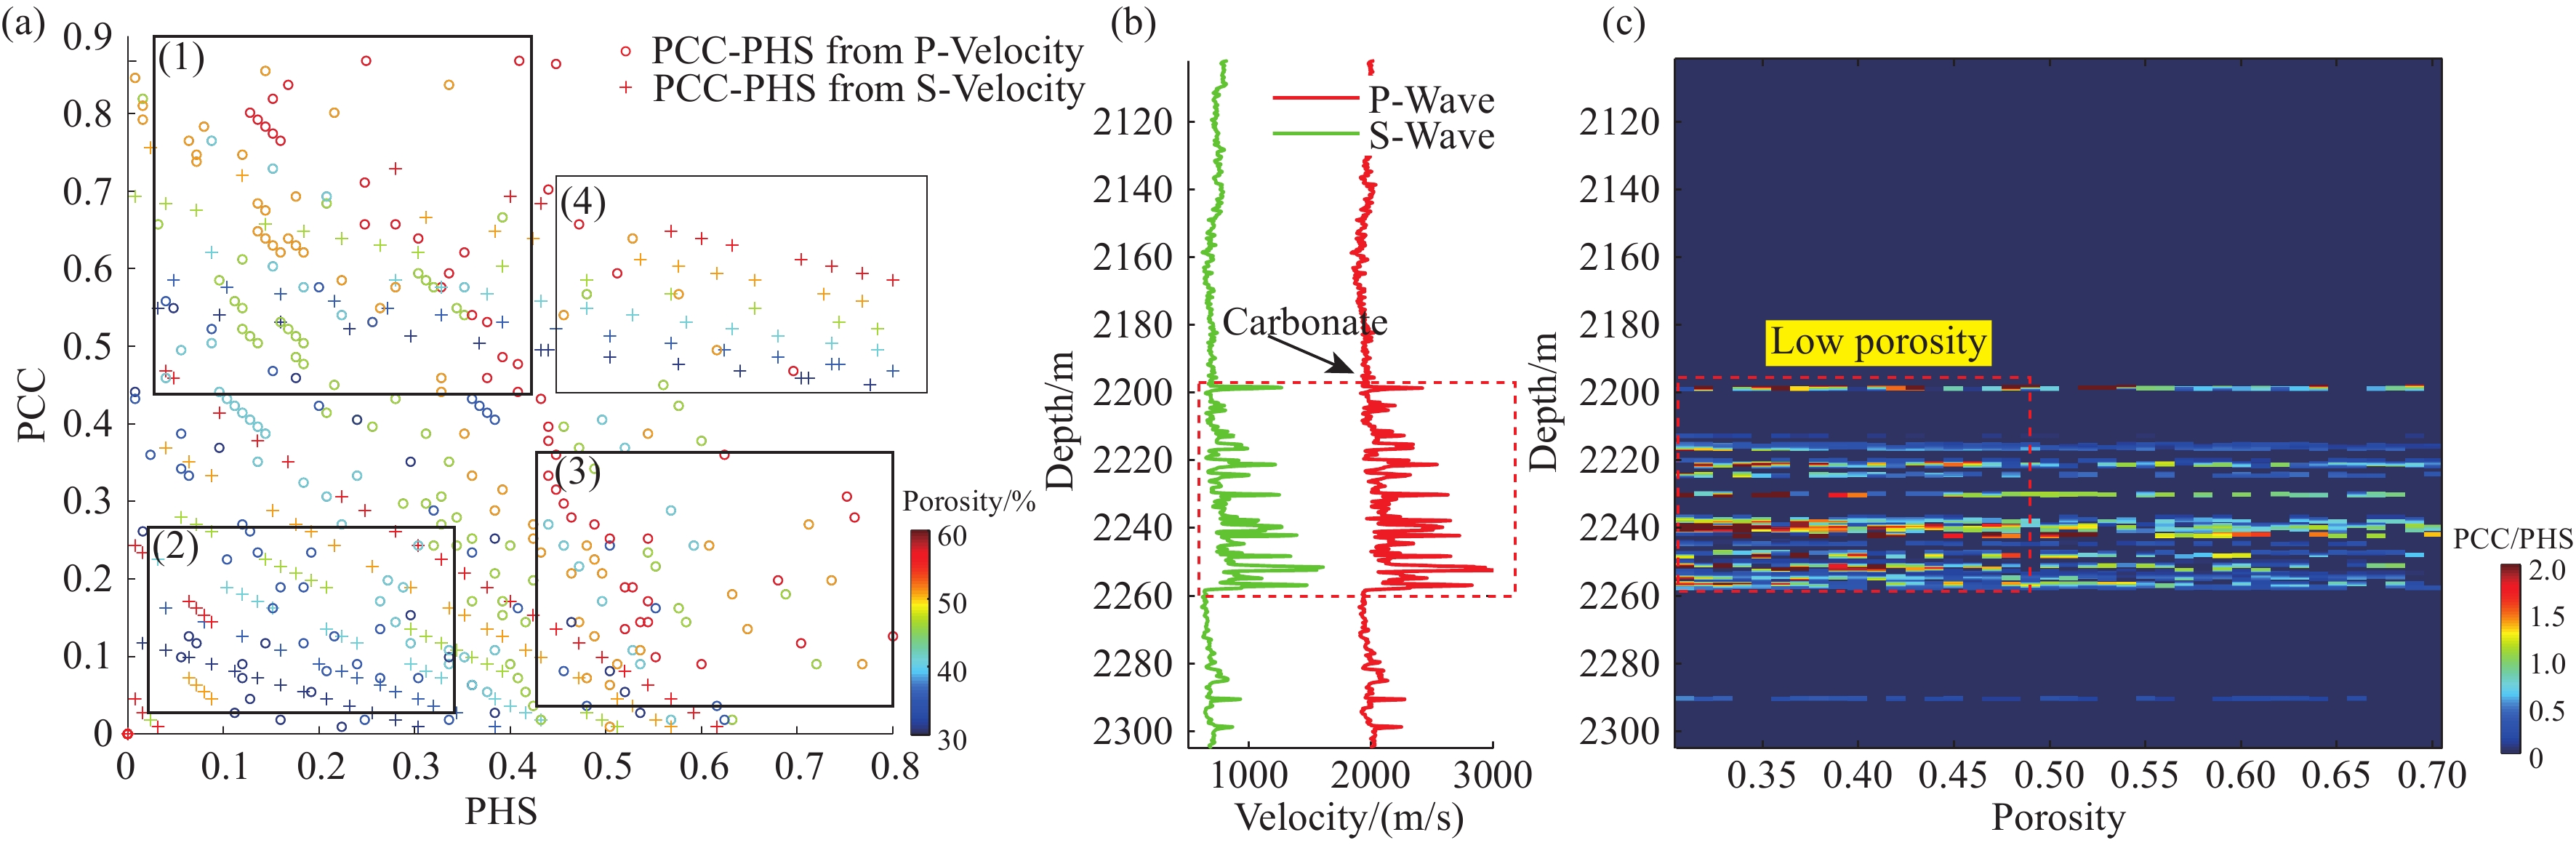
Figure 16.
XH1 fast identification results; a–PCC-PHS curve and intersection point distribution for different porosities; b–P-wave velocity and S-wave velocity; c–PCC/PHS distribution for different porosities.
-
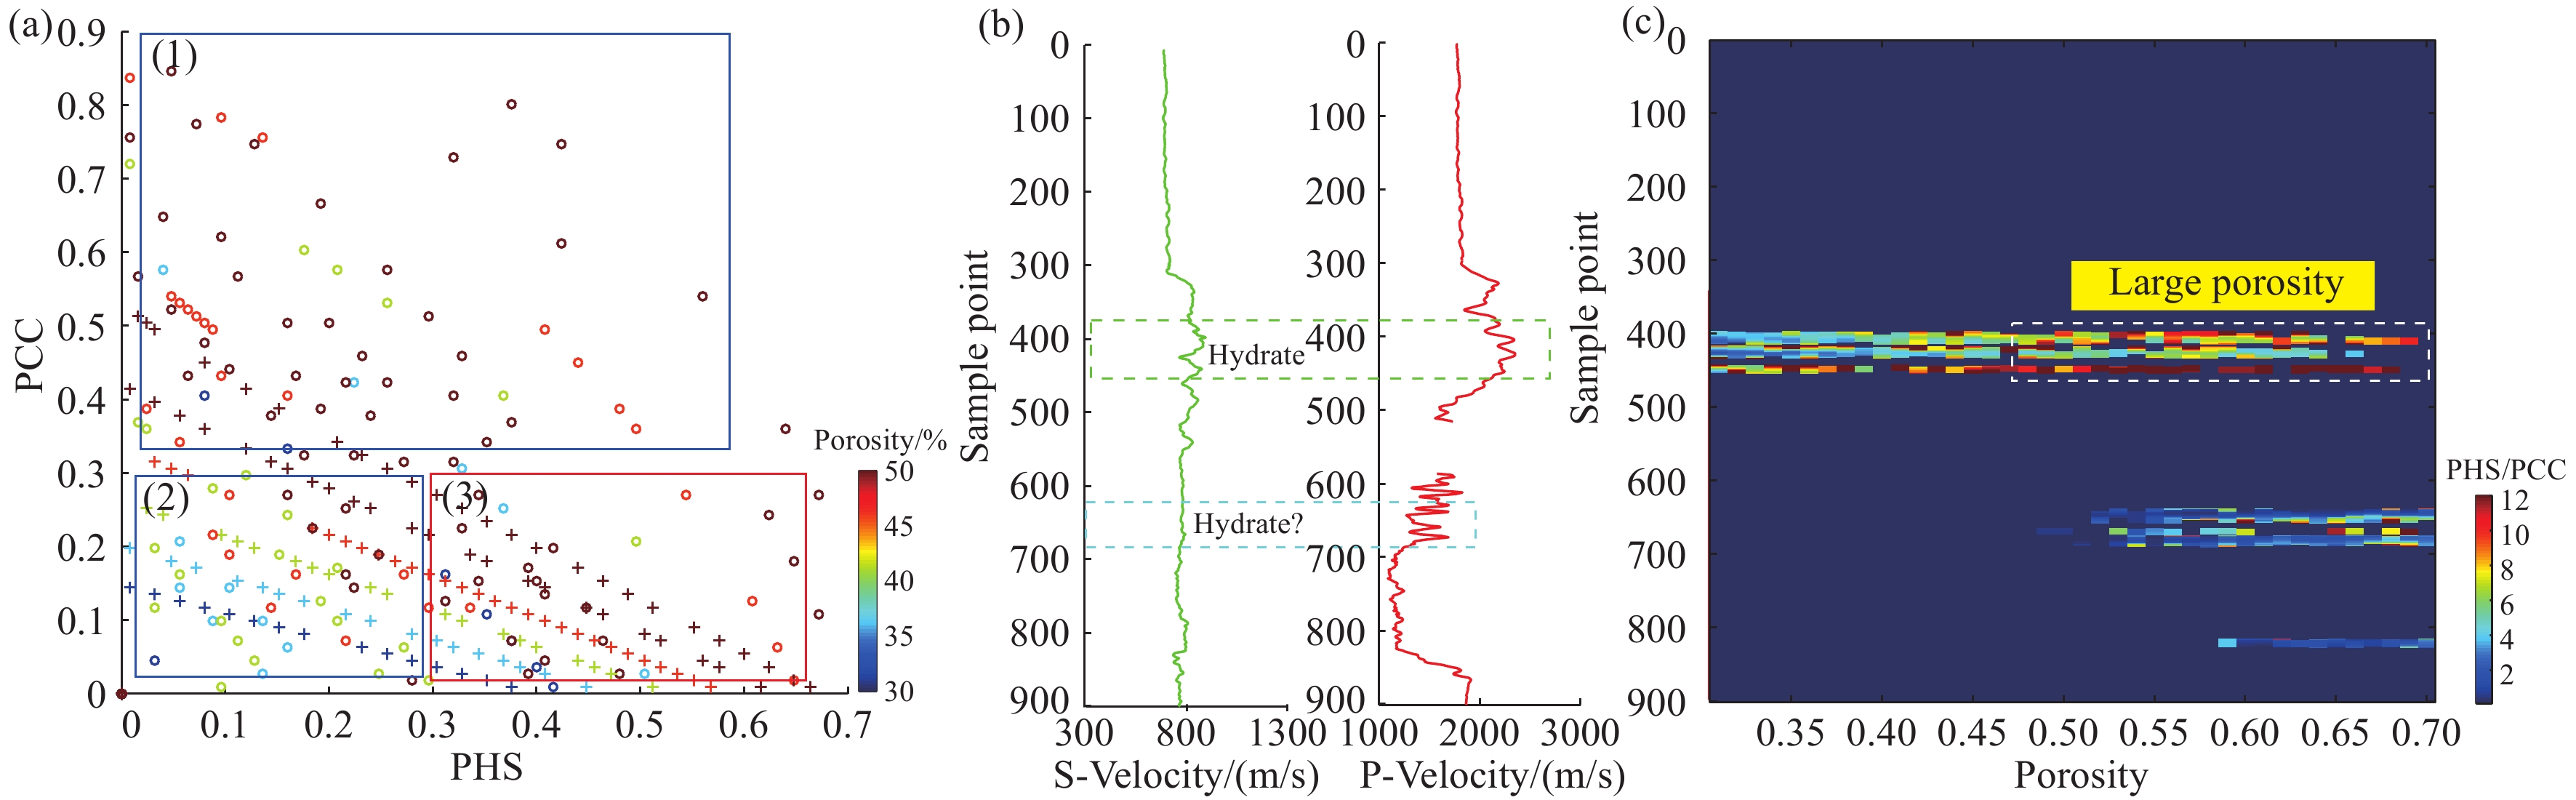
Figure 17.
SH2 fast identification results. a–PCC-PHS curve and intersection point distribution for different porosities; b–P-wave velocity and S-wave velocity; c– PCC/PHS distribution for different porosities.