
Citation: | Rui-ping Liu, Ying Dong, Guo-cang Quan, Hua Zhu, You-ning Xu, Rafaey M Elwardany, 2021. Microplastic pollution in surface water and sediments of Qinghai-Tibet Plateau: Current status and causes, China Geology, 4, 178-184. doi: 10.31035/cg2021011 |
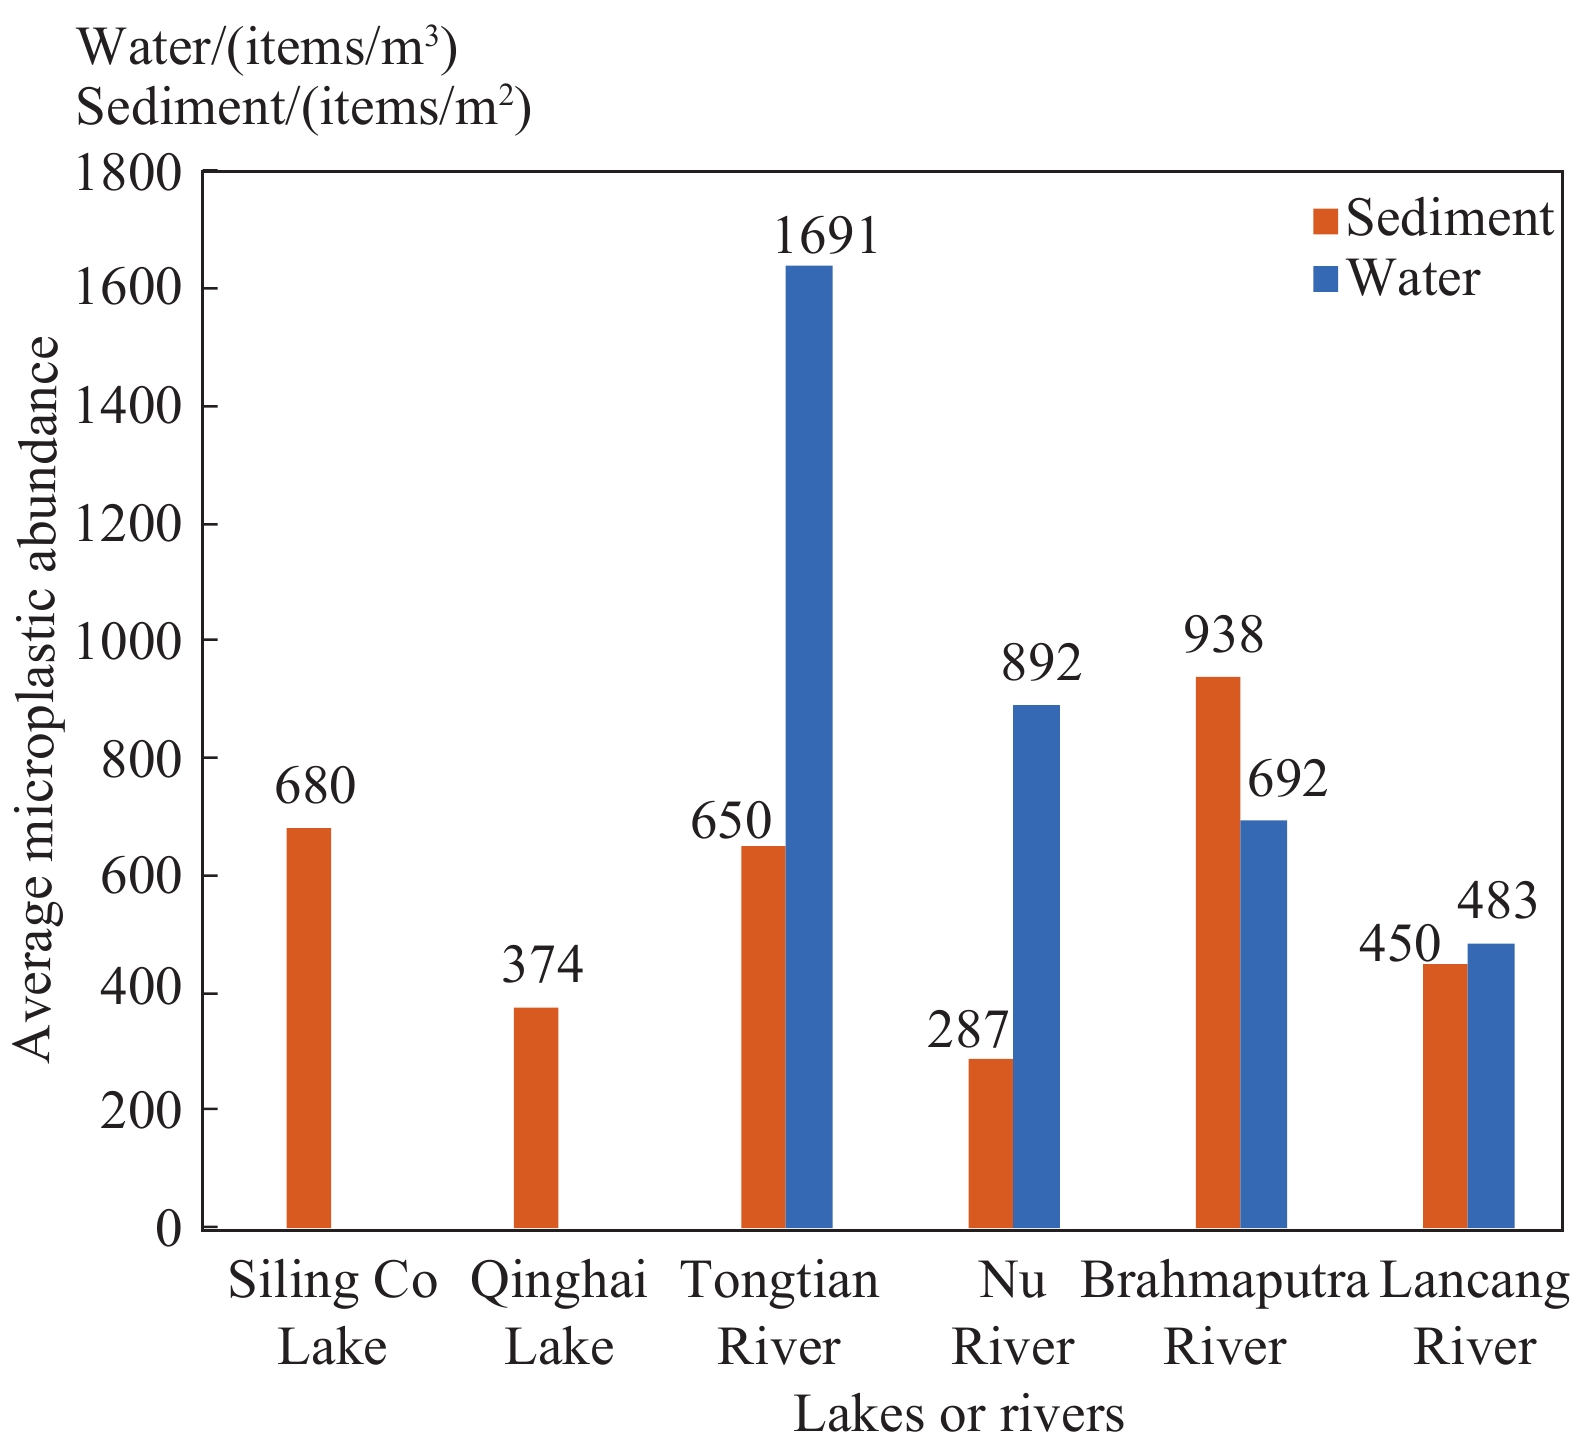
To study the current status and causes of the microplastic pollution in surface water of the Qinghai-Tibet Plateau, this paper compared the average microplastic abundance in sediments and surface water of the Qinghai-Tibet Plateau and the results are as follows. First, the average microplastic abundance in surface water of the independent rivers and the whole area is 247−2686 items/m3 and 856 items/m3, respectively. The average microplastic abundance in sediments of independent rivers or lakes and the whole area is 0−933 items/m2 and 362 items/m2, respectively. Meanwhile, the degree of microplastic pollution in river sediments is higher than that in lake sediments, and the rivers suffering from microplastic pollution mainly include the Brahmaputra River, Tongtian River, and Nujiang River. Second, compared with the microplastic pollution in other areas of the world, the levelof microplastic pollution in the lakes and rivers of the Qinghai-Tibet plateau is not lower than that of well-developed areas with more intensive human activities. Finally, this study suggests that relevant government departments of the Qinghai-Tibet Plateau should strengthen waste management strategies while developing tourism and that much attention should be paid to the impacts of microplastics in the water environment.
Plastics are a kind of high molecular polymers that have excellent physical and chemical properties such as durability, water resistance, and strong corrosion resistance. They are widely used in all walks of life but cause environmental pollution. In recent years, microplastics have drawn great attention all over the world as a new type of pollutants. In 2004, the British scholar Thompson first defined microplastics as small-sized plastic particles (Thompson RC et al., 2004), and their particle size was generally considered to be less than 5 mm in academic circles. Preliminary studies have shown that microplastics can migrate over long distances driven by external forces such as wind, rivers, and ocean currents. Therefore, they are universal in ecosystems around the world including water and sediments of beaches, lakes, and rivers and even polar regions, deep seas, and plateaus (Chen B et al., 2018; Claessens M et al., 2011; Biginagwa FJ et al., 2016; Lusher AL et al., 2015; Van Cauwenberghe L et al., 2013; Jiang CB et al., 2019; Alomar C and Deudero S, 2017; Wang J et al., 2017; Ter Halle A et al., 2017; Liu GZ et al. 2019; He L et al., 2018; Rummel CD, 2017; Vedolin MC et al., 2018). Microplastics have the characteristics of small particles, large specific surface area, and strong hydrophobicity. Therefore, they are prone to adsorb organic pollutants and heavy metals and are often eaten by organisms. This will affect the structure of individuals and populations. In addition, they can be enriched in organisms through food chains and finally transmitted to humans, causing serious health problems (Xu M et al., 2019).
The Qinghai-Tibet Plateau is known as “the Third Pole of the World”. It is characterized by a low population density, very limited human activities, and the greatest number of high-altitude inland lakes in the world. The microplastic pollution in the surface water of the Qinghai-Tibet Plateau has been reported since 2016 (Jiang C et al., 2019; Zhang K et al., 2016; Xiong X et al., 2018; Zhang S et al., 2020; Jiang CB et al., 2019), but there are very few reports on the differences of microplastics in surface water (water and sediments of rivers and lakes) in the Qinghai-Tibet Plateau. In this study, samples of surface water and sediments that were taken from lakes and rivers in the Qinghai-Tibet Plateau were compared internally and internationally to analyze and discuss the present situation of the microplastic pollution in the Qinghai-Tibet Plateau and to find out the causes. All these will provide a scientific basis for assessing and preventing microplastics pollution in this region. The Qinghai-Tibet Plateau is mainly composed of Qinghai Province and Tibet Autonomous Region. The former has a vast territory with high relief and is called “the Roof of the World” together with the latter. The Qinghai-Tibet Plateau covers a total area of about 2.5×10⁶ km2 and can be divided into six parts according to landform types, namely Altun Mountain -Qilian Mountain plateau, Qaidam-Hehuang middle-altitude basin, Qingnan plateau, the former lake basin valley area in the Southern Tibetan Plateau, the former lake basin valley area in the Northern Tibetan Plateau and Eastern Tibetan high-mountain valley area. The Qinghai-Tibet Plateau is the home of main rivers and lakes, with glaciers being widely distributed (Sun XY et al., 2019). It is also characterized by hydrological development in alpine regions and is known as the “Water Tower of China”. Furthermore, it is one of the most important ecological functional areas in China (Wang ZB et al., 2019; Dang XY et al., 2019; Zhang YS et al., 2017) and its main functions are to protect water resources, maintain biodiversity, and ensure ecological security in the Sanjiangyuan Basin. In this way, it plays an important role in ecological security in China and even Southeast Asia (Zhao L et al., 2019). However, human activities have intensified in the Qinghai-Tibet Plateau in recent years, which poses a potential threat to the ecological security and sustainable development of the region. Therefore, it is of great significance to study the distribution and causes of microplastic pollution in surface water of the Qinghai-Tibet Plateau.
Previous sampling data and methods were utilized in this paper. There are many methods for sampling microplastics in surface water and sediments. For example, for the unit of microplastic abundance, some scientists took items/km2 according to their investigation of the surface water of the Qinghai Lake, while other scientists selected items/m3 for the sake of unified assessment. Meanwhile, there are gravity sampling and volume sampling methods. The latter was employed in this paper to eliminate the interference of density. In addition, the data in existing literature acquired by the same sampling methods were selected as predecessors for comparison in this paper.
Surface water was collected from four rivers (i.e., Brahmaputra River, Nujiang River, Lancang River, and Tongtian River) and two lakes (i.e., Siling Co Lake and Qinghai Lake; Fig. 1). At each sampling point, water was taken at a depth of 0.5 m using a water collector and was packed in brown glass bottles. All tools used were cleaned with deionized water before sampling to prevent cross-contamination. The water samples should be stored at 4°C and immediately transported to the laboratory for analysis after sampling. The microplastic abundance in water samples was calculated by dividing the number of identified microplastics by water volume, followed by the calculation of average abundance. Therefore, the unit of the microplastic abundance was items/m3.
Sediment samples were sieved using sieves with a mesh size of 1 mm. Materials retained on the sieves were examined by naked eyes for potential microplastics. Samples having passed through the sieves were transferred to a glass beaker for density separation (Hidalgo-Ruz V et al., 2012). The solution used to separate microplastics from the sediment samples was prepared by dissolving potassium formate in deionized water to a density of 1.5 g/cm3. Refer to the supplementary materials for a detailed comparison of potassium formate with other solutes. After separation, the samples were settled overnight and the supernatant was filtrated onto GF/C filters. The filters were transferred into Petri dishes, oven-dried at 60°C for 30 min to 1 h, and examined under a stereomicroscope to select suspected microplastics. All the suspected microplastics were examined using an inVia Raman microscope spectroscopy (Renishaw, UK). The microplastic abundance was calculated by dividing the number of identified microplastics by surface area, followed by the calculation of the average abundance of each sampling site. Therefore, the unit of the microplastic abundance was items/m2. The spectral range of the Raman spectra used was 50−3500 cm–1, and the wavelength of the incident laser was 785 nm or 532 nm.
The calculated results of the average microplastic abundance in the sediments and water of rivers and lakes in the Qinghai-Tibet Plateau are shown in Table 1 and Table 2. As shown in these tables, microplastics are widely distributed in the surface water and sediments of major rivers and lakes in the Qinghai-Tibet Plateau, and the abundance values of each sampling point are spatially different. The average microplastic abundance in surface water of independent rivers and the whole area is 247−2686 items/m3 and 856 items/m3, respectively, with the highest and lowest abundance of surface water (i.e., 2686 items/m3 and 247 items/m3) occurring in the Chumar River and the Tuotuo River, respectively. Meanwhile, the average microplastic abundance in sediments of independent rivers or lakes and the whole area is 0−933 items/m2 and 362 items/m2, respectively, with the highest and lowest average abundance of sediments (i.e., 993 items/m2 and <4 items/m2) occurring in the southern part of Qinghai Lake and Siling Co Lake-S, respectively. Given that there is no unified standard for the assessment of microplastic pollution, the average microplastic abundance in sediments and surface water collected with the same sampling methods and calculated in the same unit was roughly compared (Fig. 2). On the whole, the average microplastic abundance in sediments of rivers or lakes are in the order of Brahmaputra River > Tongtian River > Lancang River > Qinghai Lake > Nujiang River > Siling Co Lake, while the average microplastic abundance in the water of rivers and lakes exhibits the order of Tongtian River > Nujiang River > Brahmaputra River > Lancang River. As shown in Fig. 2, the degree of microplastic pollution in sediments of the rivers is higher than that of lakes and the average microplastic abundance in water and sediments of the Brahmaputra River and Tongtian River is higher than that of the other two rivers as a whole. Since only microplastics with a particle size ranging from 20 μm to 5 mm in the Tuotuo River, Chuerma River, Dangqu River, Tongtian River, and Duochaoneng River were studied in this paper, the microplastic abundance was 4 μm, so the smaller microplastics are not counted and the abundance of microplastics is underestimated to some extent.
Site No. | First-order stream | Average abundance/(items/m2) | Lake or river | Average abundance/(items/m2) | Literature |
S1 | Siling Co Lake | 113 | Siling Co Lake-W | 563 ± 1219 | Zhang K et al., 2016 |
S2 | Siling Co Lake -NE | 8 ± 14 | Zhang K et al., 2016 | ||
S3 | Siling Co Lake -E | 46 ± 71 | Zhang K et al., 2016 | ||
S4 | Siling Co Lake -S | <4 | Zhang K et al., 2016 | ||
S5 | Geren Co Lake | 42 ± 47 | Zhang K et al., 2016 | ||
S6 | Wuru Co Lake | 117 ± 126 | Zhang K et al., 2016 | ||
S7 | Mujiu Co Lake | 17 ± 20 | Zhang K et al., 2016 | ||
S19 | Qinghai Lake | 374 | Qinghai Lake-S-1 | 575 ± 205 | Xiong X et al., 2018 |
S20 | Qinghai Lake-S-2 | 308 ± 238 | Xiong X et al., 2018 | ||
S21 | Qinghai Lake-S-3 | 508 ± 118 | Xiong X et al., 2018 | ||
S22 | Qinghai Lake-S-4 | 933 ± 1295 | Xiong X et al., 2018 | ||
S23 | Qinghai Lake-W | 50 ± 50 | Xiong X et al., 2018 | ||
S24 | Qinghai Lake-N | 167 ± 38 | Xiong X et al., 2018 | ||
S25 | Qinghai Lake-E | 83 ± 76 | Xiong X et al., 2018 | ||
S8 | Tongtian River | 650 | Buqu River | 650 ± 355 | Jiang CB et al., 2019 |
S9 | Nujiang River | 287 | Naqu River | 250 ± 35 | Jiang CB et al., 2019 |
S12 | Nyang River | 325 ± 105 | Jiang CB et al., 2019 | ||
S10 | Brahmaputra River | 938 | Lhasha River | 900 ± 10 | Jiang CB et al., 2019 |
S11 | Brahmaputra River | 975 ± 320 | Jiang CB et al., 2019 | ||
S13 | Lancang River | 450 | Lancang River | 450 ± 70 | Jiang CB et al., 2019 |
Site No. | First-order stream | Lake or river | Average abundance/(items/m3) | Membrane pore size/μm | Literature |
S8 | Tongtian River | Buqu River | 517 ± 24 | 45 | Jiang CB et al., 2019 |
S14 | Tuotuo River | 247 | 20 | Zhang S et al., 2020 | |
S15 | Chuerma River | 2686 | 20 | Zhang S et al., 2020 | |
S16 | Dangqu River | 2226 | 20 | Zhang S et al., 2020 | |
S17 | Tongtian River | 1691 | 20 | Zhang S et al., 2020 | |
S18 | Duochaoneng River | 2266 | 20 | Zhang S et al., 2020 | |
S9 | Nujiang River | Naqu River | 967 ± 141 | 45 | Jiang CB et al., 2019 |
S12 | Nyang River | 817 ± 589 | 45 | Jiang CB et al., 2019 | |
S10 | Brahmaputra River | Lhasha River | 683 ± 354 | 45 | Jiang CB et al., 2019 |
S11 | Brahmaputra River | 700 ± 94 | 45 | Jiang CB et al., 2019 | |
S13 | Lancang River | Lancang River | 483 ± 118 | 45 | Jiang CB et al., 2019 |
The microplastic abundance in water and sediments of the Qinghai-Tibet Plateau was compared with that of other areas in the world. It can be seen from Table 3 that the average microplastic abundance in sediments of rivers and lakes in the study area is very low compared with the Pearl River in China, whose flux is 10 times that of rivers in the Qinghai-Tibet Plateau. However, the average microplastic abundance in sediments of the Brahmaputra River is higher than that of the Mumbai Beach of India. Meanwhile, the average microplastic abundance in sediments of the southern part of Qinghai Lake and the western part of Siling Co Lake are also high. Table 4 shows that higher microplastic abundance in surface water occurs in the Three Gorges Reservoir and Yangtze Estuary System in China (Di M and Wang J, 2018; Zhao S et al., 2014). The flux of the Yangtze River is 2−6 times that of rivers in the Qinghai-Tibet Plateau. As the largest river in China, the Yangtze River is more affected by the inflow of tributaries. It has been proven that population density and human activities are important factors influencing microplastic abundance. Therefore, more intensive human activities around urban rivers may be the reason for the high microplastic abundance in the rivers. The abundance of the Goose Creek River and Rin River reported is about 2–3 orders of magnitude lower than that detected in the study area (Mccormick A et al., 2016; Martin J et al., 2017).
No. | Country | Lake or river | Sample type | Average abundance/(items/m2) | Literature |
1 | India | Mumbai Beach | Sediment | 68.83 | Imhof HK et al., 2013 |
2 | India | Vembanad Lake | Sediment | 252.80 ± 25.76 | Sruthy S and Ramasamy EV, 2017 |
3 | Italy | Garda Lake | Sediment | 1108 ± 983 | Imhof HK et al., 2013 |
4 | China | Pearl River Estuary | Sediment | 5595 ± 27417 | Fok L and Cheung PK, 2015 |
5 | Mexico | Estuary of Gulf of Mexico | Sediment | 5–117 | Wessel CC et al., 2016 |
No. | Country/Region | Lake or river | Sample type | Average abundance/ (items/m3) | Literature |
1 | Europe | Hunter Estuary | Water | 1032 | Hitchcock JN and Mitrovic SM, 2019 |
2 | China | Yangtze Estuary System | Water | 4137.3 ± 2461.5 | Zhao S et al., 2014 |
3 | China | Three Estuaries | Water | 100.0‒4100.0 | Zhao S et al., 2015 |
4 | China | Three Gorges Reservoir | Water | 4703 ± 2816 | Di M and Wang J, 2018 |
5 | France | Seine River | Water | 108 | Dris R et al., 2015 |
6 | France | Marne River | Water | 398 | Dris R et al., 2018 |
7 | Ecuador | Guayllabamba | Water | 1584.23 | Donoso JM et al., 2020 |
8 | Ecuador | San Pedro | Water | 168.12 | Donoso JM and Rios-Touma B, 2020 |
9 | USA | Goose Cr. | Water | 4.37 | Mccormick A et al., 2016 |
10 | Germany | Rin River | Water | Not detected | Martin J et al., 2017 |
The microplastic abundance in rivers around the world differs significantly, which is mainly due to source load and hydrodynamic, climatic, and geographical conditions (Bordós G et al., 2019; Gray AD et al., 2018; Kataoka T et al., 2019; Zhang K et al., 2016). As a nature reserve, the Qinghai-Tibet Plateau features high attitude and inhospitable climatic conditions and suffers limited impacts of human activities. The microplastics in this region may be transported by the atmosphere. Studies have shown that wind speed increases exponentially as altitude increases and the Qinghai-Tibet Plateau is subject to strong wind all year round, which is favorable for the transportation of microplastics from other regions and their accumulation (Yao Z et al., 2018). In recent years, synthetic fibers have been found in urban and suburban air dust, which also proves that the atmosphere is one of the ways of transporting microplastics (Dris R et al., 2016).
Many studies show that the level of microplastic pollution is related to population density and urbanization. Therefore, relatively intensive human activities have led to high concentrations of microplastics (Wang W et al., 2018; Wen X et al., 2018). However, even lakes and rivers in the Qinghai-Tibet Plateau that are situated in remote areas with very limited human impacts are not immune to microplastic contamination (Jiang CB et al., 2019). In fact, the level of microplastic pollution in the Qinghai-Tibet Plateau is not lower than that in well-developed areas with more intensive human activities. Plastic waste discarded by residents and tourists can be decomposed into secondary microplastics under various conditions, which are the main source of the microplastics. The Qinghai-Tibet Plateau lacks waste disposal and recycling facilities. Contrarily, a large proportion of plastic products used can be appropriately recycled and disposed of in well-developed areas, thus minimizing the quantity of plastics that enter into the environment. Besides, the government has focused on the urbanization of the Qinghai-Tibet Plateau in recent years, and plastic products have been brought into the Qinghai-Tibet Plateau with large-scale relocation and construction of houses and roads. Furthermore, most lakes in the Qinghai-Tibet Plateau are closed water systems. As a result, all plastic waste materials within the watershed can be eventually drained into surface water, which exacerbates the microplastic pollution. This study suggests that the inland water in remote areas that lack waste management strategy could also suffer from microplastic pollution, and much attention should be paid to the impacts of microplastics in these areas (Fan K et al., 2019; Li L et al., 2018).
Garbage discarded by residents and tourists is an important source of plastic waste, which can be fragmented into secondary microplastics under a variety of conditions. Some studies suggest that the intense ultraviolet ray radiation in the Qinghai-Tibet Plateau can accelerate this process (Nel HA et al., 2018).
Also, microplastic sources specific to the Qinghai-Tibet Plateau should not be ignored, which mainly include universal temple and tents in the Qinghai-Tibet Plateau (Jiang CB et al., 2019). The lungtas are small flags used for religious blessings. Most of them are now made of artificial fabrics. Some of them are burned, while others are discarded after religious activities. Tents are a simple form of shelter. They are now constructed with plastics instead of traditional animal skins and natural fibers. Plastic tents are another source of fragments and fibers of microplastics.
The conclusions of the microplastic pollution in the Qinghai-Tibet Plateau can be drawn as follows:
(i) The degree of microplastic pollution in river sediments is higher than that in lake sediments. The rivers suffering from microplastic pollution mainly include the Brahmaputra River, Tongtian River, and Nujiang River.
(ii) The microplastic pollution in the Qinghai-Tibet Plateau was compared with other areas in the world. The lakes and rivers in the Qinghai-Tibet Plateau suffer from microplastic contamination to some extent due to high altitude, bad weather, and human activities. However, the level of microplastic pollution in the Qinghai-Tibet Plateau is not lower than that in well-developed areas with more intensive human activities.
(iii) This study suggests that the relevant government departments of Qinghai-Tibet Plateau should strengthen waste management strategies while developing tourism and that much attention should be paid to the impacts of microplastics in the water environment.
Rui-ping Liu conceived of the presented idea. Rui-ping Liu developed the theory and performed the computations. Rui-ping Liu and Guo-cang Quan verified the analytical methods. Zi-guo Hao encouraged Rui-ping Liu to investigate microplastics pollution and supervised the findings of this work. All the authors discussed the results and contributed to the final manuscript.
The authors declare no conflicts of interest.
This study was funded by the survey projects initiated by the Ministry of Natural Resources of the People’s Republic of China (DD20189220, 1212010741003, 1212011220224, and 121201011000150022), the Public Welfare Scientific Research Project launched by the Ministry of Natural Resources of the People’s Republic of China (201111020), the project of 2015 Natural Science Basic Research Plan of Shaanxi Province (2015JM4129), the project of 2016 Fundamental Research Funds for the Central Universities (open fund; 310829161128), and the project of 2021 Fundamental Research Funds for the Central Universities (open fund).
Alomar C, Deudero S. 2017. Evidence of microplastic ingestion in the shark Galeus melastomus Rafinesque, 1810 in the continental shelf off the western mediterranean sea. Environmental Pollution, 223, 223–229. doi: 10.1016/j.envpol.2017.01.015. |
Biginagwa FJ, Mayoma BS, Shashoua Y, Syberg K, Khan FR. 2016. First evidence of microplastics in the African Great Lakes: Recovery from Lake Victoria Nile perch and Nile tilapia. Journal of Great Lakes Research, 42 (1), 146−149. http://377.rm.cglhub.com/10.1016/j.jglr.2015.10.012 doi: 10.1016/j.jglr.2015.10.012. |
Bordós G, Urbányi B, Micsinai A, Kriszt B, Palotai Z, Szabó I, Hantosi Z, Szoboszlay S. 2019. Identification of microplastics in fish ponds and natural freshwater environments of the Carpathian basin, Europe. Chemosphere, 216, 110–116. doi: 10.1016/j.chemosphere.2018.10.110. |
Chen B. 2018. Review of the source distribution and ecological effects of marine microplastics. Environmental Protection Science, 44(2), 90–97 (in Chinese with English abstract). doi: 10.16803/j.cnki.issn.1004-6216.2018.02.018. |
Claessens M, De Meester S, Van Landuyt L, De Clerck K, Janssen CR. 2011. Occurrence and distribution of microplastics in marine sediments along the Belgian coast. Marine pollution bulletin, 62(10), 2199–2204. doi: 10.1016/j.marpolbul.2011.06.030. |
Dang XY, Chang L, Lu N. 2019. The impact of climatic warm-wet situation of the Tibetan Plateau on the water resources and environment in Qaidam Basin. Geology in China, 46(2), 359–368 (in Chinese with English abstract). |
Di M, Wang J. 2018. Microplastics in surface waters and sediments of the Three Gorges Reservoir, China. Science of The Total Environment, 616−617, 1620–1627. doi: 10.1016/j.scitotenv.2017.10.150. |
Donoso JM, Rios-Touma B. 2020. Microplastics in tropical Andean rivers: A perspective from a highly populated Ecuadorian basin without wastewater treatment. Heliyon, (6), 1–11. doi: 10.1016/j.heliyon.2020.e04302. |
Dris R, Gasperi J, Rocher V, Saad M, Renault N, Tassin B. 2015. Microplastic contamination in an urban area: A case study in Greater Paris. Environmental Chemistry, 12(5), 592–599. doi: 10.1071/EN14167. |
Dris R, Gasperi J, Rocher V, Tassin B. 2018. Synthetic and non-synthetic anthropogenic fibers in a river under the impact of ParisMegacity: Sampling methodological aspects and flux estimations. Science of The Total Environment, 618, 157–164. doi: 10.1016/j.scitotenv.2017.11.009. |
Dris R, Gasperi J, Saad M, Mirande C, Tassin B. 2016. Synthetic fibers in atmospheric fallout: A source of microplastics in the environment? Marine pollution bulletin, 104(1−2), 290–293. doi: 10.1016/j.marpolbul.2016.01.006. |
Fan K, Zhang Q, Singh VP, Sun P, Song C, Zhu X, Yu H, Shen Z. 2019. Spatiotemporal impact of soil moisture on air temperature across the Tibet Plateau. Science of the Total Environment, 649, 1338–1348. doi: 10.1016/j.scitotenv.2018.08.399. |
Fok L, Cheung PK. 2015. Hong Kong at the Pearl River Estuary: A hotspot of microplastic pollution. Marine Pollution Bulletin, 99(1−2), 112–118. doi: 10.1016/j.marpolbul.2015.07.050. |
Gray AD, Wertz H, Leads RR, Weinstein JE. 2018. Microplastic in two South Carolina Estuaries: Occurrence, distribution, and composition. Marine Pollution Bulletin, 128, 223–233. doi: 10.1016/j.marpolbul.2018.01.030. |
He L, Huang FJ, Yin KD. 2018. The ecological effect of marine microplastics as a biological vector. Journal of Tropical Oceanography, 37(4), 1–8. doi: 10.11978/2017112. |
Hidalgo-Ruz V, Gutow L, Thompson RC, Thiel M. 2012. Microplastics in the marine environment: A review of the methods used for identification and quantification. Environmental Science & Technology, 46(6), 3060–3075. doi: 10.1021/es2031505. |
Hitchcock JN, Mitrovic SM. 2019. Microplastic pollution in estuaries across a gradient of human impact. Environmental Pollution, 247, 457–466. doi: 10.1016/j.envpol.2019.01.069. |
Imhof HK, Ivleva NP, Schmid J, Niessner R, Laforsch C. 2013. Contamination of beach sediments of a subalpine lake with microplastic particles. Current Biology, 23, 867–868. doi: 10.1016/j.cub.2013.09.001. |
Jiang CB, Yin L, Li Z, Wen XF, Luo X, Hu SP, Yang HY, Long YN, Deng B, Huang LZ. 2019. Microplastic pollution in the rivers of the Tibet Plateau. Environmental Pollution, 249, 91–98. doi: 10.1016/j.envpol.2019.03.022. |
Kataoka T, Nihei Y, Kudou K, Hinata H. 2019. Assessment of the sources and inflow processes of microplastics in the river environments of Japan. Environmental pollution, 244, 958–965. doi: 10.1016/j.envpol.2018.10.111. |
Li L, Wu J, Lu J, Min X, Xu J, Yang L. 2018. Distribution, pollution, bioaccumulation, and ecological risks of trace elements in soils of the northeastern Qinghai-Tibet Plateau. Ecotoxicology and Environmental Safety, 166, 345–353. doi: 10.1016/j.ecoenv.2018.09.110. |
Liu GZ, Zhu ZL, Yang YX, Sun YR, Fei Y, Jie M. 2019. Sorption behavior and mechanism of hydrophilic organic chemicals to virgin and aged microplastics in freshwater and seawater. Environmental Pollution, 246, 26–33. doi: 10.1016/j.envpol.2018.11.100. |
Lusher AL, Tirelli V, O’Connor I, Officer R. 2015. Microplastics in Arctic polar waters: The first reported values of particles in surface and sub-surface samples. Scientific Reports, 5, 1–9. doi: 10.1038/srep14947. |
Martin J, Lusher A, Thompson RC, Morley A. 2017. The deposition and accumulation of microplastics in marine sediments and bottom water from the Irish continental shelf. Scientific Reports, 7, 10772. doi: 10.1038/s41598-017-11079-2. |
Mccormick A, Hoellein T, London M, Hittie J, Scott J, Kelly J. 2016. Microplastic in surface waters of urban rivers: Concentration, sources, and associated bacterial assemblages. Ecosphere, 7(11), 1–22. doi: 10.1002/ecs2.1556. |
Nel HA, Dalu T, Wasserman RJ. 2018. Sinks and sources: Assessing microplastic abundance in river sediment and deposit feeders in an Austral temperate urban river system. Science of the Total Environment, 612, 950–956. doi: 10.1016/j.scitotenv.2017.08.298. |
Rummel CD, Jahnke A, Gorokhova E, Gorokhova E. 2017. Impacts of biofilm formation on the fate and potential effects of microplastic in the aquatic environment. Environmental Science & Technology Letters, 4(7), 258–267. doi: 10.1016/j.jhazmat.2020.124187. |
Sun XY, Zhang RJ, Huang W, Sun A, Lin LJ, Xu HG, Jiang DC. 2019. The response between glacier evolution and eco-geological environment on the Qinghai-Tibet Plateau. China Geology, 2, 1–7. doi: 10.31035/cg2018078. |
Sruthy S, Ramasamy EV. 2017. Microplastic pollution in Vembanad Lake, Kerala, India: The first report of microplastics in lake and estuarine sediments in India. Environmental Pollution, (22), 315–322. doi: 10.1016/j.envpol.2016.12.038. |
Ter Halle A, Ladirat L, Martignac M, Martignac M, Mingotaud AF, Boyron O, Perez E. 2017. To what extent are microplastics from the open ocean weathered? Environmental Pollution, 227, 167–174. doi: 10.1016/j.envpol.2017.04.051. |
Thompson RC, Olsen Y, Mitchell RP, Mitchell RP, Davis A, Rowland SJ, John AWG, McGonigle D, Russell AE. 2004. Lost at sea: Where is all the plastic? Science, 304(5672), 838–838. doi: 10.1126/science.1094559. |
Van Cauwenberghe L, Vanreusel A, Mees J, Janssen CR. 2013. Microplastic pollution in deep-sea sediments. Environmental Pollution, 182, 495–499. doi: 10.1016/j.envpol.2013.08.013. |
Vedolin MC, Teophilo CYS, Turra A, Figueira RCL. 2018. Spatial variability in the concentrations of metals in beached microplastics. Marine Pollution Bulletin, 129(2), 487–493. doi: 10.1016/j.marpolbul.2017.10.019. |
Wang J, Peng J, Tan Z, Gao Y, Zhan Z, Chen Q, Cai L. 2017. Microplastics in the surface sediments from the Beijiang River littoral zone: Composition, abundance, surface textures and interaction with heavy metals. Chemosphere, 171, 248–258. doi: 10.1016/j.chemosphere.2016.12.074. |
Wang W, Yuan W, Chen Y, Wang J. 2018. Microplastics in surface waters of Dongting lake and Hong lake, China. Science of the Total Environment, 633, 539–545. doi: 10.1016/j.scitotenv.2018.03.211. |
Wang ZB, Li RH, Yang SY, Bai FL, Mei X, Zhang J, Lu K. 2019. Comparison of detrital mineral compositions between stream sediments of the Yangtze River (Changjiang) and the Yellow River (Huanghe) and their provenance implication. China Geology, 2(2), 169–178. doi: 10.31035/cg2018065. |
Wen X, Du C, Xu P, Zeng G, Huang D, Yin L, Yin Q, Hu L, Wan J, Zhang J, Tan S, Deng R. 2018. Microplastic pollution in surface sediments of urban water areas in Changsha, China: Abundance, composition, surface textures. Marine Pollution Bulletin, 136, 414–423. doi: 10.1016/j.marpolbul.2018.09.043. |
Wessel CC, Lockridge GR, Battiste D, Cebrian J. 2016. Abundance and characteristics of microplastics in beach sediments: Insights into microplastic accumulation in northern Gulf of Mexico estuaries. Marine Pollution Bulletin, 109, 178–183. doi: 10.1016/j.marpolbul.2016.06.002. |
Xiong X, Kai Z, Chen XC, Shi HH, Ze L, Chen XW. 2018. Sources and distribution of microplastics in China’s largest inland lake-Qinghai Lake. Environmental Pollution, 235(1), 899–906. doi: 10.1016/j.envpol.2017.12.081. |
Xu M, Halimu G, Zhang Q, Song YB, Fu XH, Li YQ, Li YS, Zhang HW. 2019. Internalization and toxicity: A preliminary study of effects of nanoplastic particles on human lung epithelial cell. Science of the Total Environment, 694, 1–10. doi: 10.1016/j.scitotenv.2019.133794. |
Yao Z, Li X, Xiao J. 2018. Characteristics of daily extreme wind gusts on the Qinghai-Tibet Plateau, China. Journal of Arid Land, 10(5), 673–685. doi: 10.1007/s40333-018-0094-y. |
Zhang K, Su J, Xiong X, Wu X, Wu CX, Liu JT. 2016. Microplastic pollution of lakeshore sediments from remote lakes in Tibet plateau, China. Environmental Pollution, (219), 450–455. doi: 10.1016/j.envpol.2016.05.048. |
Zhang S, Pan X, Lin L, Tao JX, Liu M. 2020. Preliminary study on the composition and distribution characteristics of microplastics in water from the source region of the Yangtze River. Journal of Yangtze River Scientific Research Institute, 1–8 (in Chinese with English abstract). doi: 10.11988/ckyyb.20200174. |
Zhang YS, Sun L, Yin XL, Meng H. 2017. Progress and prospect of research on environmental geology of China: A review. Geology in China, 44(5), 901–912 (in Chinese with English abstract). |
Zhao L, Li W, Lin L, Guo WJ, Zhao WH, Tang XQ, Gong DD, Li QY, Xu P. 2019. Field investigation on river hydrochemical characteristics and larval and juvenile fish in the source region of the Yangtze River. Water, 11(7), 1–20. doi: 10.3390/w11071342. |
Zhao S, Zhu L, Li D. 2015. Microplastic in three urban estuaries, China. Environmental Pollution, 206, 597–604. doi: 10.1016/j.envpol.2015.08.027. |
Zhao S, Zhu L, Wang T, Li D. 2014. Suspended microplastics in the surface water of the Yangtze Estuary System, China: First observations on occurrence, distribution. Marine Pollution Bulletin, 86, 562–568. doi: 10.1016/j.marpolbul.2014.06.032. |
Site No. | First-order stream | Average abundance/(items/m2) | Lake or river | Average abundance/(items/m2) | Literature |
S1 | Siling Co Lake | 113 | Siling Co Lake-W | 563 ± 1219 | Zhang K et al., 2016 |
S2 | Siling Co Lake -NE | 8 ± 14 | Zhang K et al., 2016 | ||
S3 | Siling Co Lake -E | 46 ± 71 | Zhang K et al., 2016 | ||
S4 | Siling Co Lake -S | <4 | Zhang K et al., 2016 | ||
S5 | Geren Co Lake | 42 ± 47 | Zhang K et al., 2016 | ||
S6 | Wuru Co Lake | 117 ± 126 | Zhang K et al., 2016 | ||
S7 | Mujiu Co Lake | 17 ± 20 | Zhang K et al., 2016 | ||
S19 | Qinghai Lake | 374 | Qinghai Lake-S-1 | 575 ± 205 | Xiong X et al., 2018 |
S20 | Qinghai Lake-S-2 | 308 ± 238 | Xiong X et al., 2018 | ||
S21 | Qinghai Lake-S-3 | 508 ± 118 | Xiong X et al., 2018 | ||
S22 | Qinghai Lake-S-4 | 933 ± 1295 | Xiong X et al., 2018 | ||
S23 | Qinghai Lake-W | 50 ± 50 | Xiong X et al., 2018 | ||
S24 | Qinghai Lake-N | 167 ± 38 | Xiong X et al., 2018 | ||
S25 | Qinghai Lake-E | 83 ± 76 | Xiong X et al., 2018 | ||
S8 | Tongtian River | 650 | Buqu River | 650 ± 355 | Jiang CB et al., 2019 |
S9 | Nujiang River | 287 | Naqu River | 250 ± 35 | Jiang CB et al., 2019 |
S12 | Nyang River | 325 ± 105 | Jiang CB et al., 2019 | ||
S10 | Brahmaputra River | 938 | Lhasha River | 900 ± 10 | Jiang CB et al., 2019 |
S11 | Brahmaputra River | 975 ± 320 | Jiang CB et al., 2019 | ||
S13 | Lancang River | 450 | Lancang River | 450 ± 70 | Jiang CB et al., 2019 |
Site No. | First-order stream | Lake or river | Average abundance/(items/m3) | Membrane pore size/μm | Literature |
S8 | Tongtian River | Buqu River | 517 ± 24 | 45 | Jiang CB et al., 2019 |
S14 | Tuotuo River | 247 | 20 | Zhang S et al., 2020 | |
S15 | Chuerma River | 2686 | 20 | Zhang S et al., 2020 | |
S16 | Dangqu River | 2226 | 20 | Zhang S et al., 2020 | |
S17 | Tongtian River | 1691 | 20 | Zhang S et al., 2020 | |
S18 | Duochaoneng River | 2266 | 20 | Zhang S et al., 2020 | |
S9 | Nujiang River | Naqu River | 967 ± 141 | 45 | Jiang CB et al., 2019 |
S12 | Nyang River | 817 ± 589 | 45 | Jiang CB et al., 2019 | |
S10 | Brahmaputra River | Lhasha River | 683 ± 354 | 45 | Jiang CB et al., 2019 |
S11 | Brahmaputra River | 700 ± 94 | 45 | Jiang CB et al., 2019 | |
S13 | Lancang River | Lancang River | 483 ± 118 | 45 | Jiang CB et al., 2019 |
No. | Country | Lake or river | Sample type | Average abundance/(items/m2) | Literature |
1 | India | Mumbai Beach | Sediment | 68.83 | Imhof HK et al., 2013 |
2 | India | Vembanad Lake | Sediment | 252.80 ± 25.76 | Sruthy S and Ramasamy EV, 2017 |
3 | Italy | Garda Lake | Sediment | 1108 ± 983 | Imhof HK et al., 2013 |
4 | China | Pearl River Estuary | Sediment | 5595 ± 27417 | Fok L and Cheung PK, 2015 |
5 | Mexico | Estuary of Gulf of Mexico | Sediment | 5–117 | Wessel CC et al., 2016 |
No. | Country/Region | Lake or river | Sample type | Average abundance/ (items/m3) | Literature |
1 | Europe | Hunter Estuary | Water | 1032 | Hitchcock JN and Mitrovic SM, 2019 |
2 | China | Yangtze Estuary System | Water | 4137.3 ± 2461.5 | Zhao S et al., 2014 |
3 | China | Three Estuaries | Water | 100.0‒4100.0 | Zhao S et al., 2015 |
4 | China | Three Gorges Reservoir | Water | 4703 ± 2816 | Di M and Wang J, 2018 |
5 | France | Seine River | Water | 108 | Dris R et al., 2015 |
6 | France | Marne River | Water | 398 | Dris R et al., 2018 |
7 | Ecuador | Guayllabamba | Water | 1584.23 | Donoso JM et al., 2020 |
8 | Ecuador | San Pedro | Water | 168.12 | Donoso JM and Rios-Touma B, 2020 |
9 | USA | Goose Cr. | Water | 4.37 | Mccormick A et al., 2016 |
10 | Germany | Rin River | Water | Not detected | Martin J et al., 2017 |
Distribution of microplastics sampling sites in rivers and lakes of the Qinghai-Tibet Plateau. The yellow spots are the sampling sites.
Average microplastic abundance in sediments or surface water of lakes or rivers in the Qinghai-Tibet Plateau, China.