Processing math: 100%

Mao-sheng Gao, Guo-hua Hou, Xian-zhang Dang, Xue-yong Huang, 2020. Sediment distribution characteristics and environment evolution within 100 years in western Laizhou Bay, Bohai Sea, China, China Geology, 3, 445-454. doi: 10.31035/cg2020036
Citation: Mao-sheng Gao, Guo-hua Hou, Xian-zhang Dang, Xue-yong Huang, 2020. Sediment distribution characteristics and environment evolution within 100 years in western Laizhou Bay, Bohai Sea, China, China Geology, 3, 445-454. doi: 10.31035/cg2020036

Sediment distribution characteristics and environment evolution within 100 years in western Laizhou Bay, Bohai Sea, China

More Information
  • This study is about the reconstruction of fluvial origins based on the grain size distribution of sediment deposits in the western Laizhou Bay, Bohai Sea, China. Thirteen sediment cores were selected to research sediment characteristics using the Sahu discriminant formula, C-M diagram, and Folk method. The results showed: (1) Bounded by the Guangli River estuary, the north sediment was affected by the water and sand flowing from the Yellow River during different periods. The south sediment came from multi-source rivers under the influence of the Xiaoqing River, Mihe River, and other coastal rivers; (2) the deposited sediments were dated by a clear historical record of the branched channel oscillation combined with the characteristics of the diversion channel, erosion, and regression. The subaqueous delta overlapped during several Yellow River channel runs (1897–1904, 1929–1934, 1938–1947, 1947–1953, 1976–1996) and the deposited sediment facies changed (the north tidal flat-abandoned subaqueous delta-lateral delta-delta front); (3) the deposited sediment characteristics can be revealed by studying the branched diversions of the Yellow River and coastal multi-rivers of the past one hundred years.

  • Multisource rivers play important roles in transforming deposited sediment characteristics in the coastal zone. The flux of small and medium rivers, especially those of small mountainous river systems (SMRS), may have more influence on the sedimentary environment in coastal regions (Wheatcroft RA et al., 2010). The role of small and medium-sized rivers in the global cycles is of great concern to many international geoscience cooperation research projects (Kremer HH, 2004). They primarily study material migration, sedimentation, and the hydrodynamics of small and medium-sized rivers (Zhang J, 2011). Currently, studies of the rivers mainly focus on the Mekong River Basin (Liu JP et al., 2017), the western coast of the United States (Hatten JA et al., 2012), the Taiwan Island of China (Hsiung KH and Saito Y, 2017) and the eastern coast of China’s Zhejiang Province (Xue CF et al., 2018).

    Grain-size characteristics are usually used to reflect the sediment migration pattern because it can comprehensively explain the material source and sedimentary dynamic environment (Li T and Li TJ, 2018). There are basic marine surveys and researches but they primarily focus on the formation and evolution of the Yellow River delta, branched channel changes and sedimentation (Cui BL and Li XY, 2011; Bi NS et al., 2014; Qiao SQ et al., 2011; Wang HJ et al., 2006). The characteristics of hydrology, deposition, and coastal were changed in the Yellow River delta based on core record (Chen GD et al., 1986; Yang HR and Wang J, 1990; Pang JZ and Jiang MX, 2003). The radionuclides (210Pb and 137Cs) in deltaic sediment have been widely used to study modern sediment deposition, dispersal, and sedimentary processes (Kuehl SA et al., 1996; Palinkas CM and Nittrouer CA, 2007). Zhou LY et al. (2016) analyzed sediment characteristics and accumulation rates from the delta front to the prodelta of the Yellow River. However, stable sedimentary conditions (such as stable material sources, stable accumulation rates) and an unaltered sedimentary environment are required in practical application. The deposition rate can’t calculate in the blank deposition area where it was abandoned (Xue CT et al., 2009). It is hard to confirm the dating but it is directly determined by combining historical geography with sedimentary geology at this swinging estuary.

    The sedimentary characteristics of the multi-source river delta in the Laizhou Bay have been preliminarily recognized since the Holocene period (Xue CT and Ding D, 2008). This doesn’t ignore the sedimentary contributions of small and medium-sized rivers (such as the Guangli River, the Xiaoqing River, and the Mihe River) to the west of Laizhou Bay except for the Yellow River (Gao MS et al., 2019; Yin P et al., 2018). The sedimentary environment evolution of the Yellow River delta is restricted by the sediment condition and the marine hydrodynamics (Peng J and Chen CL, 2009; Wang F et al., 2019). There will be a comprehensive understanding of the deposited sedimentary evolution in the western Laizhou Bay under the influence of small and medium-sized rivers. In this study, the authors selected thirteen cores to research the deposited sediment characteristics and reconstructed sediment distribution patterns in the western Laizhou Bay.

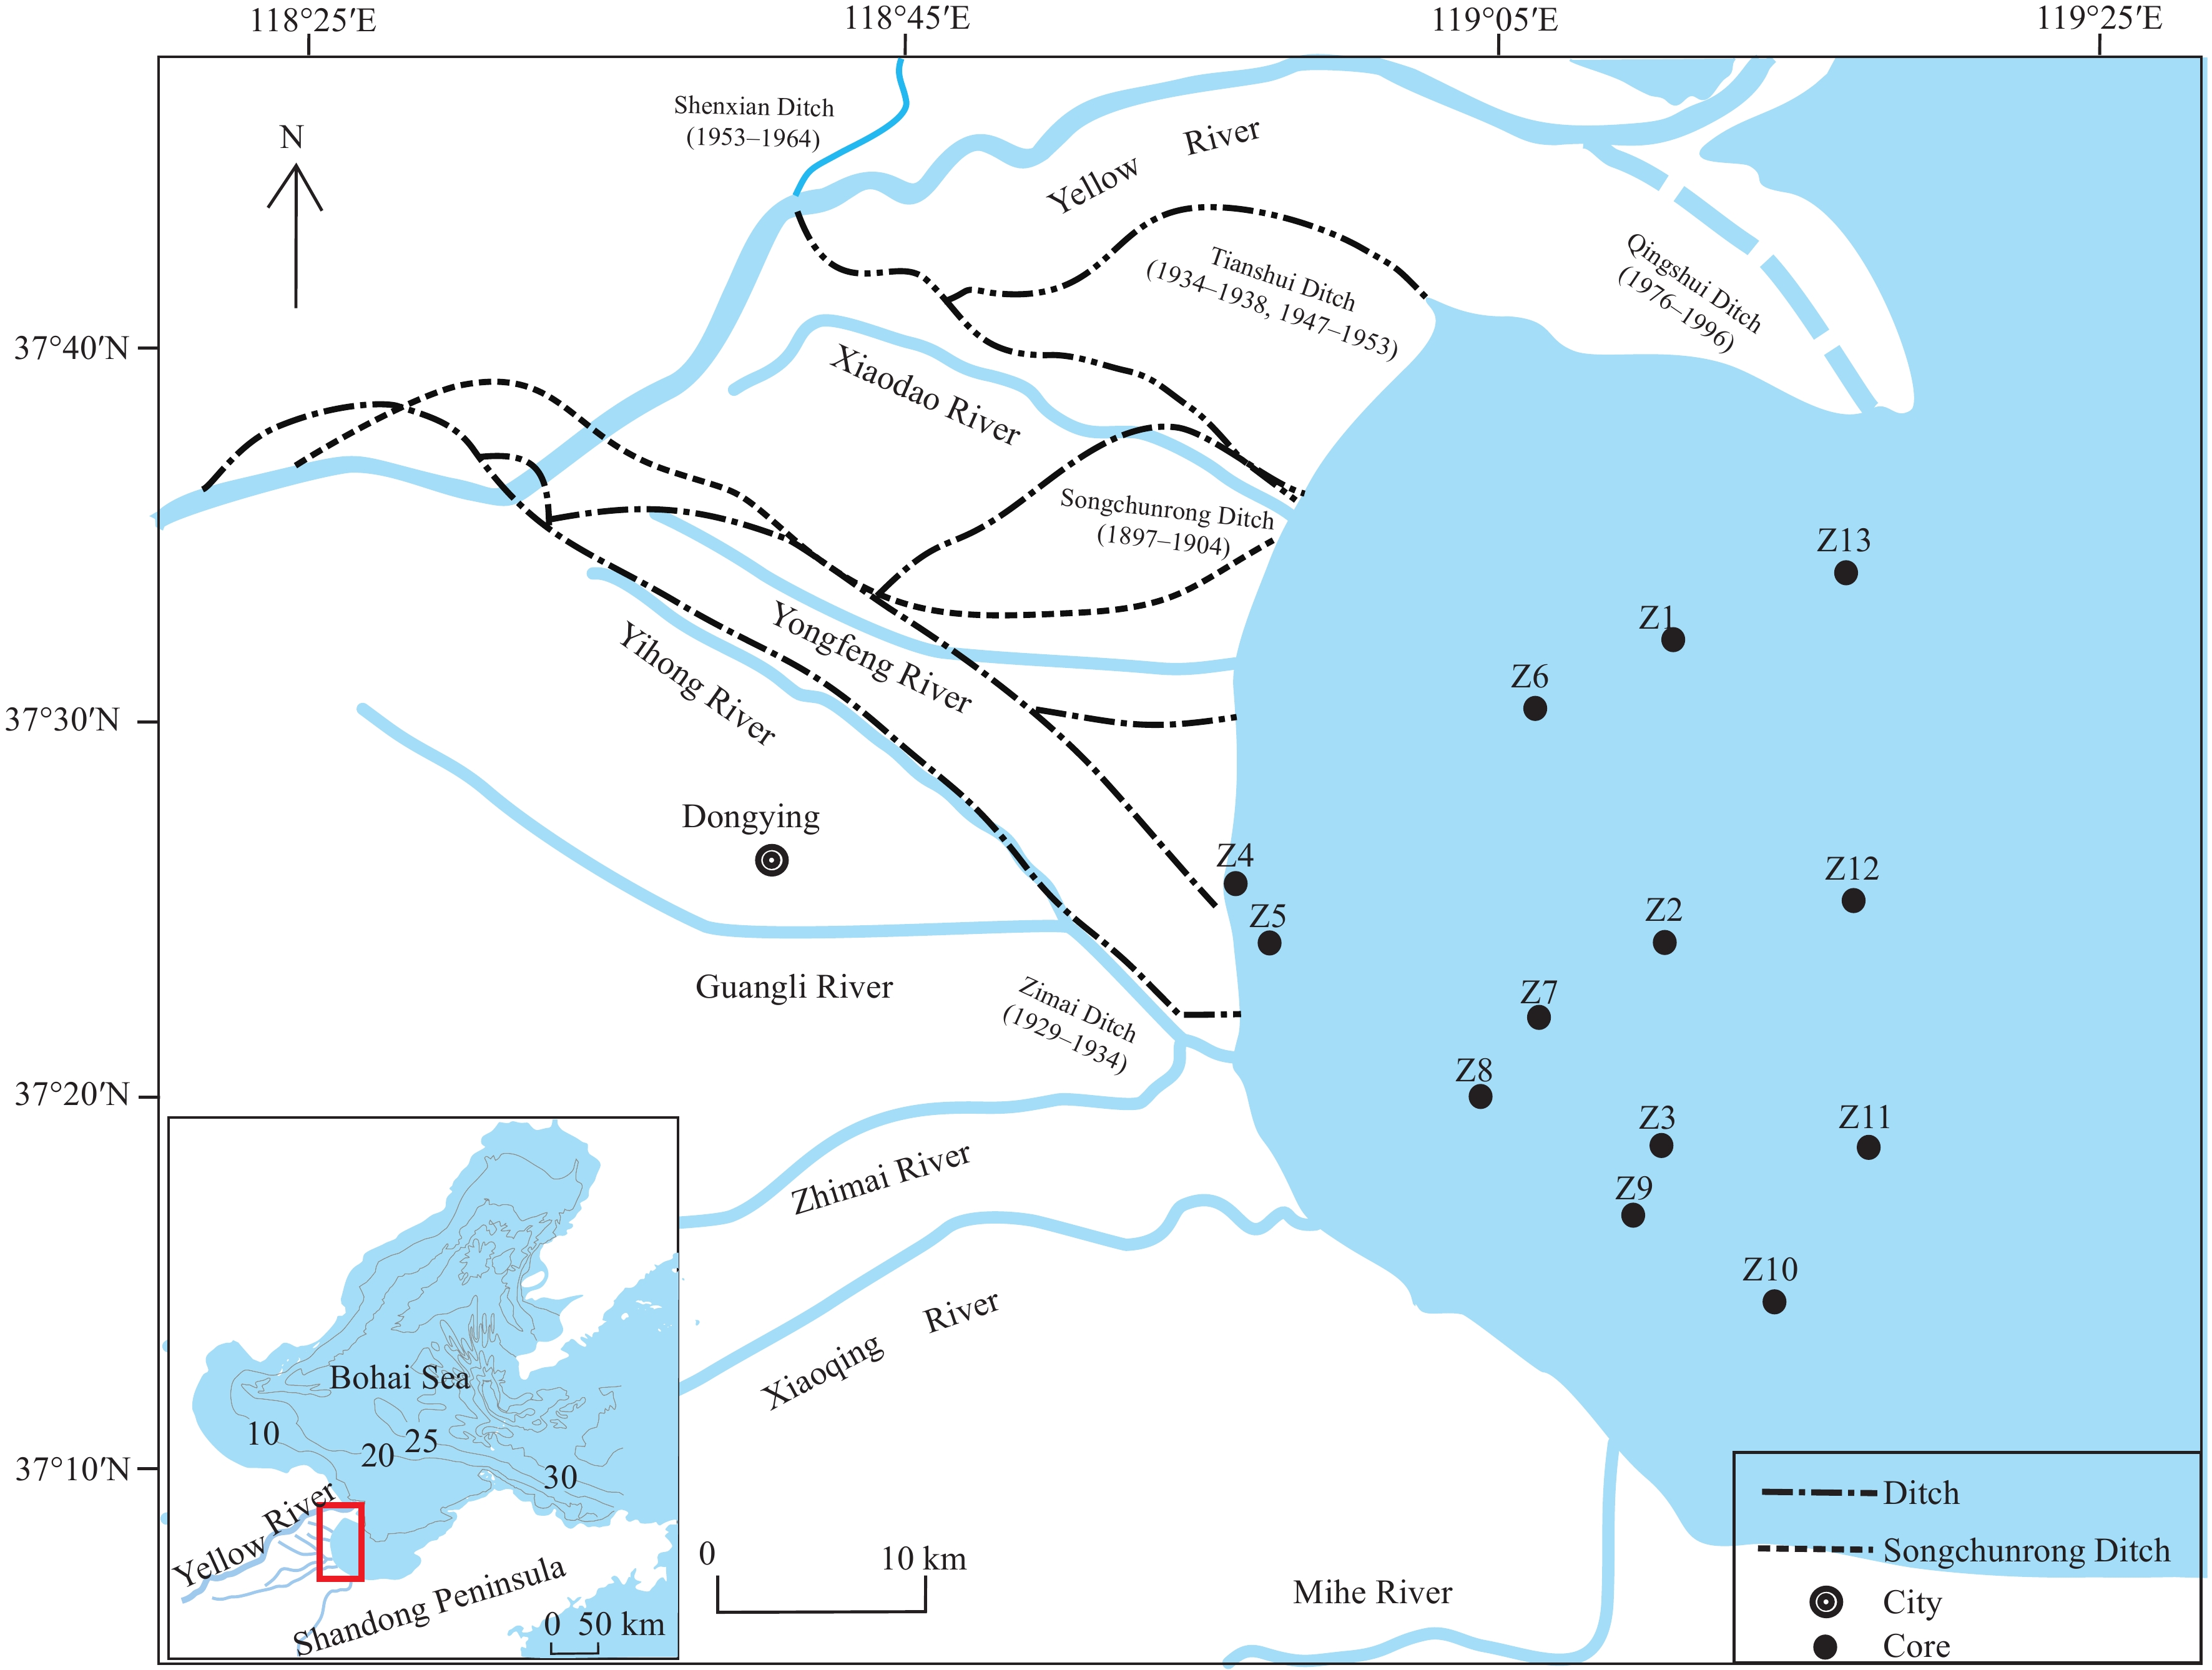
    The study area is located in the western Laizhou Bay (Fig. 1; 118°57′N–119°21′N, 37°05′E–37°45′E) between the branches of the Yishu Rift. Since the Neogene, this region turns into a stable period, with few tectonic movements and peaceful deposition (Yu Z et al., 2008). In terms of physiognomy, the western of Laizhou Bay is classified as a coastal alluvial plain/marine deposition plain. Outcropped strata in this area mainly comprise of Holocene and Pleistocene alluvial and marine sediments. The thickness of the sedimentary layers increases gradually from west to east. There are clayey silt sedimentary areas of the southern lateral in the modern Yellow River delta and silty sedimentary areas of multiple rivers in the area. Some coastal rivers were also developed, such as the Xiaodao River, Yongfeng River, Guangli River, Zimai River, Xiaoqing River, Mihe River, and the Bailang River (from north to south). The clayey silt of the delta lateral is distributed on both sides of the silt (delta front). The younger delta front silt overlays the older delta lateral (interdistributary bay) with clayey silt and the younger delta lateral clayey silt overlays the older delta front silt simultaneously (Xue CT et al., 2009).

    Figure 1.  The location of research area and 13 core sites in western of the Laizhou Bay.

    The distributary channel of the modern Yellow River delta has undergone 12 diversions since 1855 (Ye QH et al., 2007). The main distributary channel flowed to the western Laizhou Bay including the Zimai Ditch (1929–1934), the Songchunrong Ditch (1897–1904), the Tianshui Ditch (1934–1938, 1947–1953) and the Qingshui Ditch (1976–1996). During these periods, the diversion channel of the Yellow River was changed to flow northward [the Diaokou River (1964–1976), and the Shenxian Ditch (1953–1964)]. The Yellow River was diverted to the east in 1976 (Fig.1).

    There are two kinds of coastal rivers in the western Laizhou Bay. One is the natural river as represented by the Xiaoqing River and Mihe River. The other is represented by artificial rivers such as the Guangli River [a diversion channel of the Yellow River (1929–1934)]. Then the river was artificially converted to a channel with flood controlling and drainage (Yang RM et al., 2005). There are tributaries (such as the Yihong River and the Zimai River) that flow down the Guangli River. As per earlier research (Xue CT et al., 2009), the sedimentary environment of the southern Laizhou Bay is more affected by the Xiaoqing River (heavy runoff) and the Mihe River (high sediment discharge). The central part of Laizhou Bay is covered with aggradational plains by a diversity of sources and complex sedimentary environments (Qin YS et al., 1985).

    Thirteen cores (Z1–Z13) were supported by China Geological Survey project (GZH201200505) in 2013–2015 (Fig.1; Table 1), and the sedimentary samples in the cores were collected below the sediment surface using fiber-reinforced plastic graduated tubes (with an inner diameter of 100 mm; and a wall thickness of 5 mm). During sample collections, a hand-held global positioning system (GPS) was used to identify the location of sites.

    Table 1.  Location and sample records of 13 columnar deposits in the western Laizhou Bay.
    SampleLongitude/
    N
    Latitude/
    E
    Water depth/mLength/
    cm
    Sampling time
    Z1119°10′34″37°31′53″6250Aug-Nov, 2013
    Z2119°10′19″37°23′47″8268Aug-Nov, 2013
    Z3119°10′07″37°18′21″4306Aug-Nov, 2013
    Z4118°55′47″37°25′22″0120Sep-14, 2015
    Z5118°56′57″37°23′47″0108Sep-14, 2015
    Z6119°05′53.27″37°30′00.51″5203Jul-Dec, 2015
    Z7119°05′59.40″37°21′46.42″5191Jul-Dec, 2015
    Z8119°04′00.90″37°19′39.86″2142Jul-Dec, 2015
    Z9119°09′12.02″37°16′28.72″4100Jul-Dec, 2015
    Z10119°14′02.98″37°14′11.60″2115Jul-Dec, 2015
    Z11119°17′10.39″37°18′15.42″6159Jul-Dec, 2015
    Z12119°16′39.70″37°24′56.54″8190Jul-Dec, 2015
    Z13119°16′17.05″37°33′38.26″9101Jul-Dec, 2015
     | Show Table
    DownLoad: CSV

    Sediment cores are 1–3 m in length. The cores were strictly sealed after collection and transported and stored vertically. Half of each core was preserved, and the remaining half was sampled at 2 cm intervals. The sample grain size was analyzed with a Mastersizer 2000 laser grain size analyzer and divided based on the Udden-Wentworth grain size standard (McManus J, 1988). The measurement range is 0.02–2000 μm.

    Quality assurance and quality control were assessed in duplicate with blank samples and standard reference materials. The quality of the analytical procedures was tested by recovery measurements based on the Chinese national geo-standards GBW07309 and GBW07429. Sample tests were completed at the Marine Geological Experimental Testing Center, Ministry of Natural Resources, China. The measurement accuracy was ±5%.

    The sedimentary content of particle sizes was calculated by sample test results of sand (<4 Φ), silt (4–8 Φ), and clay (>8 Φ). A triangular diagram of the “sand-silty-clay” distribution in sediment was prepared by Folk Method (Folk RL et al., 1970). The cumulative content and corresponding particle size of the sample grain size curve was extracted, and the cumulative probability curve was plotted. Some important parameters such as Mean grain size (Mz), Sorting coefficient (So), Skewness (Sk), and Kurtosis (Kg) were calculated by Folk and Ward formulas (Folk RL and Ward WC, 1957).

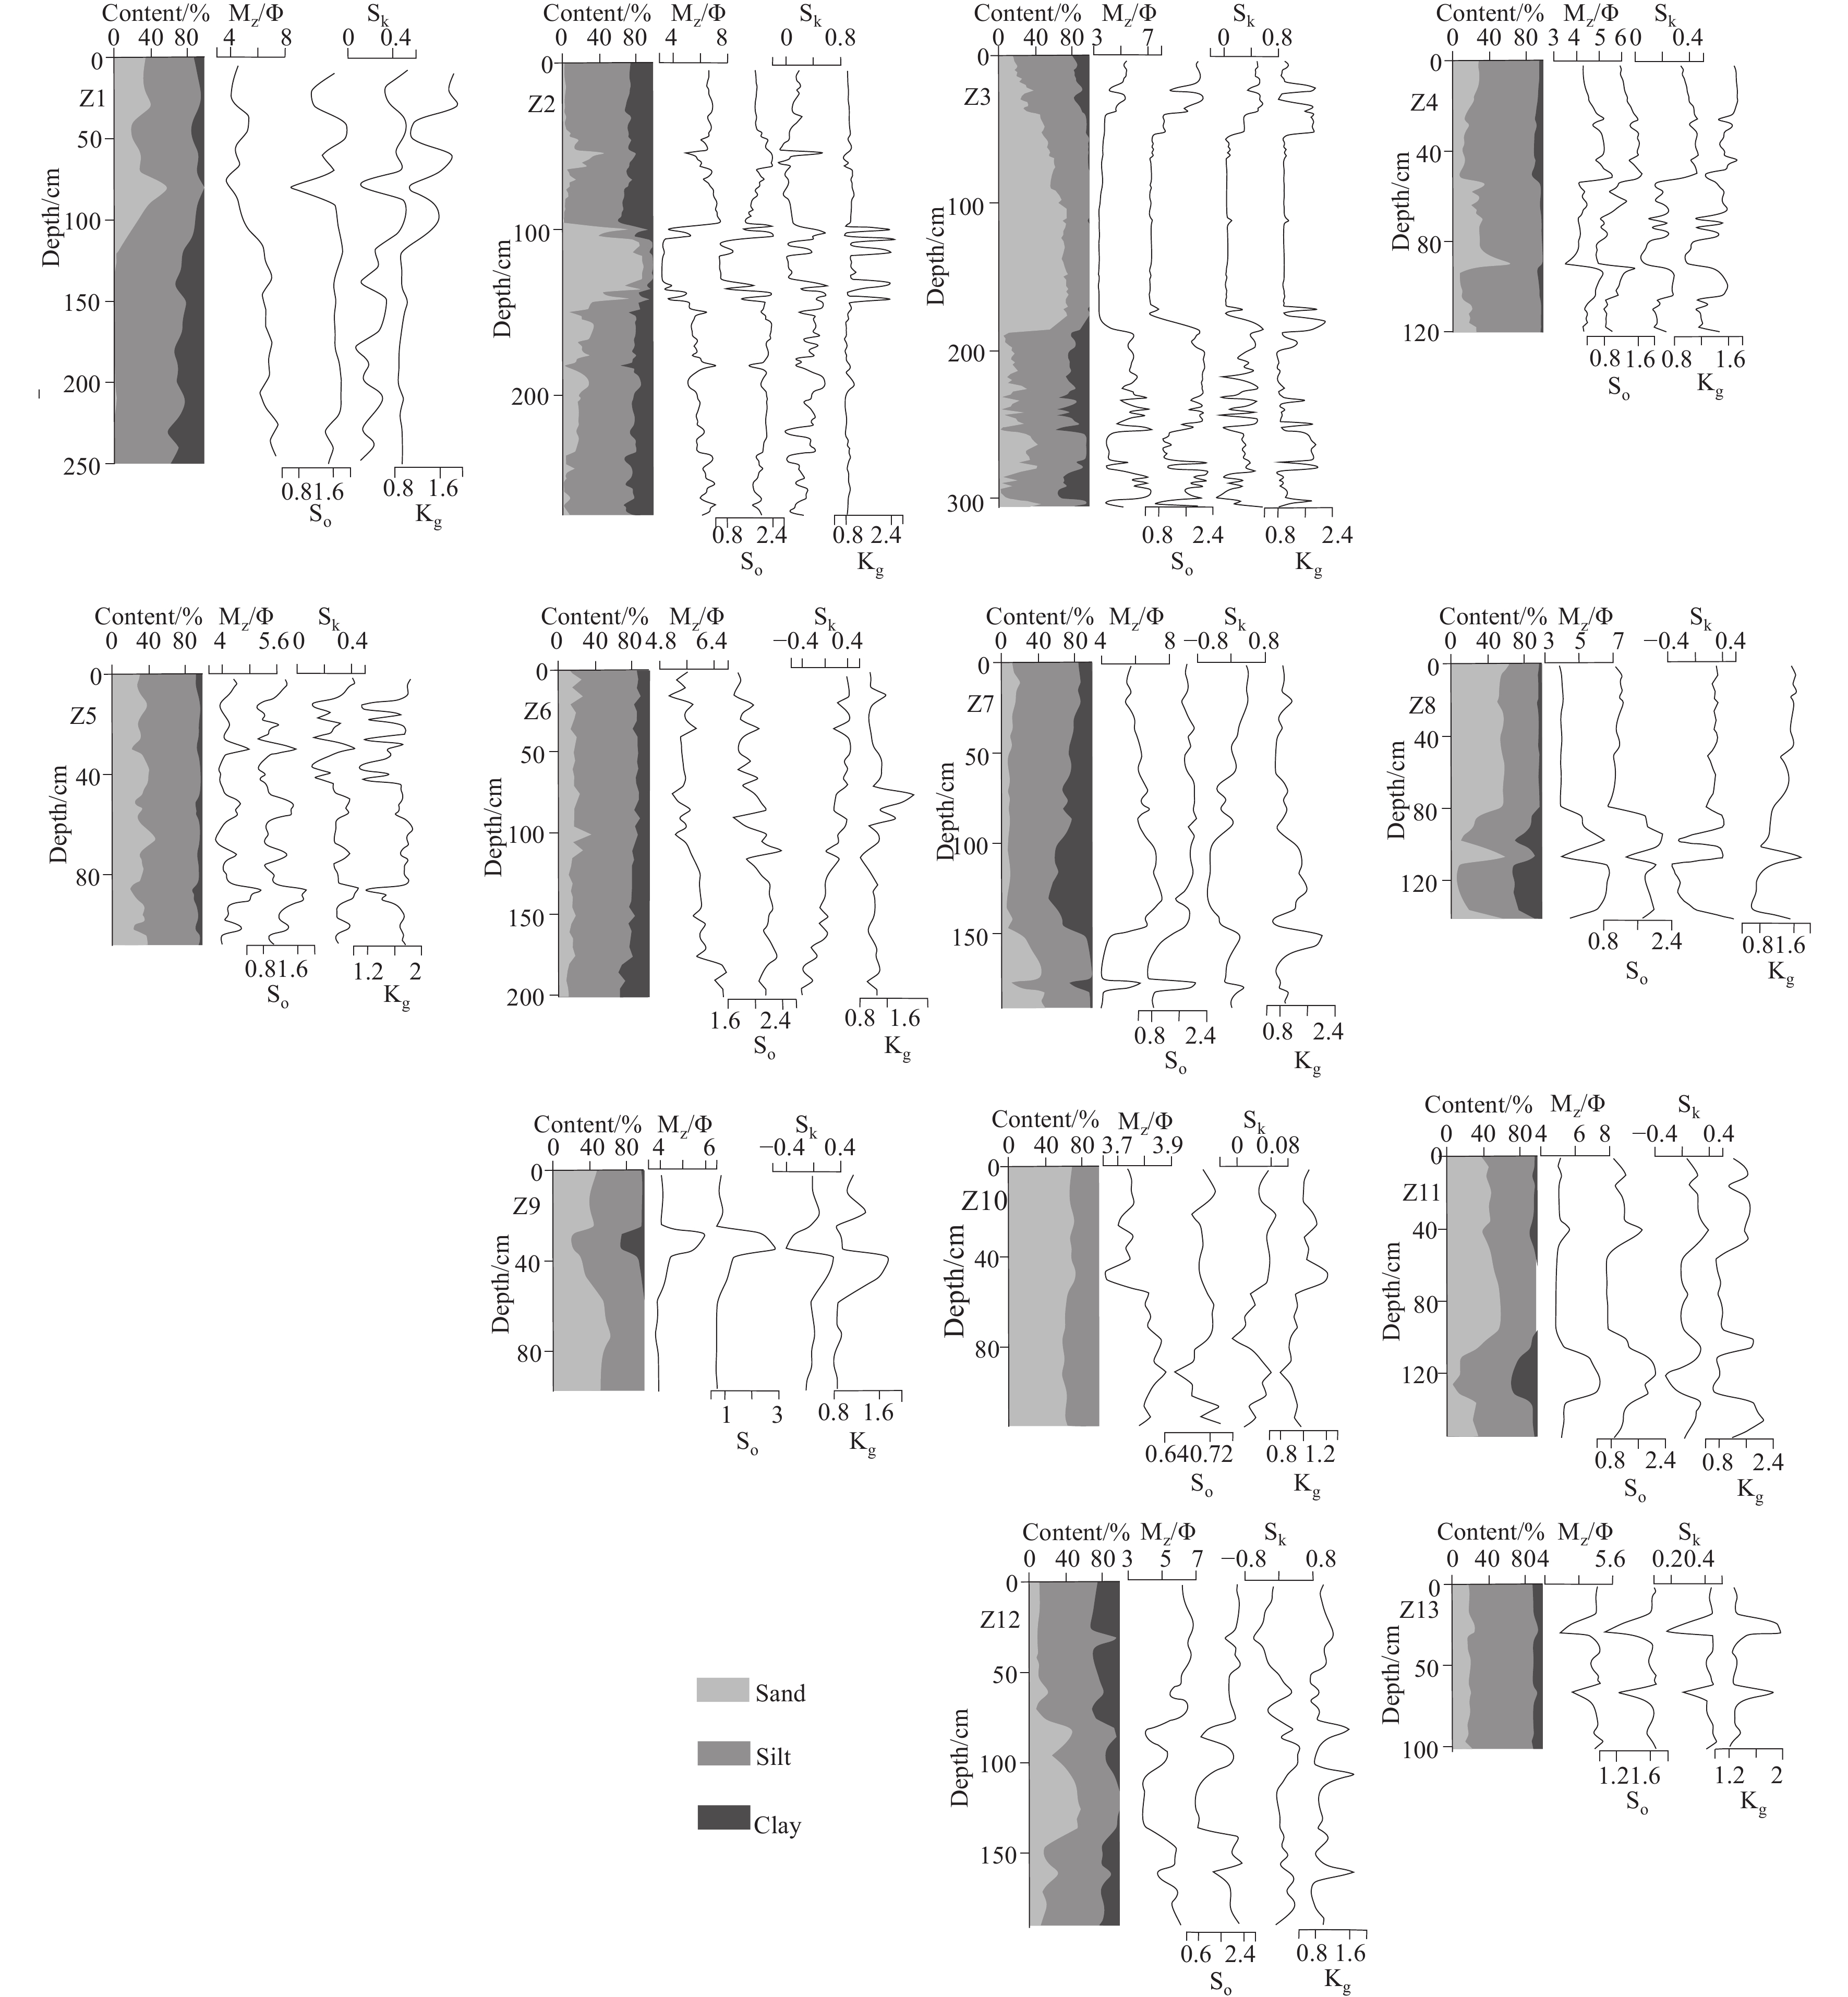
    The grain size distributions of sedimentary samples which are plotted in the triangular diagram are relatively concentrated in four areas (Fig. 2): Lateral delta (Z1, Z6, Z13), northern tidal (Z4, Z5), central (Z2, Z7, Z12), and southern section (Z3, Z8, Z9, Z10, and Z11). There are mainly three deposited sediment types: Silt, sandy silt, and silty sand (Fig. 3). According to the distribution of the grain size and main parameters (Figs. 2, 3), it can be described grouping sections in sediment cores by their geographical location (lateral delta, northern tidal, central, southern section) and some calculated sediment parameters such as Mz, So, Sk, and Kg (Table 2).

    Figure 2.  Triangular diagram of sand-silt-clay in column samplings.
    Figure 3.  Vertical grain size distribution and the main parameters in 13 cores.
    Table 2.  Statistics result of the main parameter in core samples.
    SiteCoreValueSand/%Silt/%Clay/%MzSoSkKgWater depth/mSource
    Delta lateralZ1Max61.0379.4442.517.591.920.531.96–4– –8Yellow River
    Min038.9703.590.610.050.85
    Average14.1466.1319.735.8041.590.311.18
    Z6Max35.7174.2934.446.772.400.461.65
    Min7.8351.1610.025.041.65–0.410.80
    Average15.8065.8318.365.792.020.141.05
    Z13Max26.7674.2912.465.381.680.481.97
    Min13.9066.734.374.361.060.161.19
    Average19.1170.7010.195.131.560.411.38
    North tidalZ4Max66.3886.6814.245.631.740.481.760– –4Guangli estuary
    Min5.6932.470.083.480.600.040.96
    Average21.1972.885.934.581.160.281.45
    Z5Max48.7572.1512.735.221.840.461.88
    Min18.5248.582.223.790.620.101.05
    Average32.9962.344.674.191.070.301.62
    Southern sectionZ3Max77.3178.8939.377.422.250.632.25–2– –6Xiaoqing River, Mihe River
    Min0.2322.6903.340.51–0.120.73
    Average41.8148.589.614.521.240.211.13
    Z8Max63.4366.3433.586.832.180.551.86
    Min5.4731.842.473.870.86–0.360.61
    Average42.3846.4911.134.721.410.181.29
    Z11Max60.2166.6829.507.542.170.402.11
    Min6.1739.7904.840.65–0.260.65
    Average40.5552.466.995.451.160.111.25
    Z9Max64.3262.7426.916.062.950.311.81
    Min19.2835.6803.790.68–0.430.80
    Average44.4750.634.914.271.09–0.031.05
    Z10Max75.4742.0603.890.750.091.23
    Min57.9424.5303.650.66–0.020.79
    Average66.0233.9803.780.710.050.98
    The centralZ2Max89.5376.3440.527.492.450.622.63–6– –8All rivers
    Min010.4703.110.50–0.160.71
    Average23.0655.1121.825.761.850.220.97
    Z7Max48.5373.3749.637.602.080.472.06
    Min5.2245.1504.010.65–0.570.65
    Average16.5960.7722.645.921.65–0.061.01
    Z12Max58.1791.4436.076.842.440.481.77
    Min8.5641.8303.880.72–0.640.67
    Average25.2257.9016.885.501.770.030.98
     | Show Table
    DownLoad: CSV

    The lateral delta area: Grain sizes of the column cores (Z1, Z6, and Z13) were dominated by silt and downward-fining vertically in the modern Yellow River estuary. The grain parameter values of So, Sk, Kg were 1.6, 0.4, and 1.2, respectively.

    The northern tidal area: Grain size of the column core (Z4, Z5) dominated by sandy silt and changed periodically with depth in the Guangli estuary. The grain parameter values of So, Sk, Kg were 1.6, 0.4, and 1.2, respectively. The ranges in Z4 were divided into three sections with a depth of 55 cm and 92 cm, and the ranges in Z5 were divided into four sections with a depth of 30 cm, 52 cm, and 86 cm.

    The central area: Grain size of the column core (Z2, Z7, and Z12) dominated by silty and clayey with sand content in certain depths. The highest values of sandy content were 80–140 cm depth in Z12, 100–130 cm in Z2, and the lowest value was 150 cm depth in Z7.

    The southern section area: Deposited sediment in core Z3, Z8, Z9, Z10, and Z11 was dominated by silty sand on the southern coast. The main particle parameters remained stable except for individual depths.

    To verify the relationship between coastal rivers and marine deposited sediments, representative columnar samples were selected to identify the sediment environment using Sahu Discriminant Formula (Sahu BK, 1964) by the size analysis of clastic sediments. The value of the discriminant parameter (Y) can be computed by the following Eq. (1).

    Y=0.285MZ8.76So4.893Sk+0.048Kg (1)

    where Y is the value of the discriminant parameter.

    When Y>−7.4190, represents neritic deposit. Y<−7.4190, represents a fluvial deposit. By data statistics, Y (the average value of neritic sediment) was −5.3160, and Y (the value of fluvial deposit) was −10.4418. The discriminant value is shown in vertical distribution parameters from 13 cores (Table3; Fig. 4).

    Table 3.  Identification values of neritic sediment and fluvial deposit.
    Coastal riverCoreY
    Yellow RiverZ13–32.1887
    Z1–22.7472
    Z6–35.1430
    Guangli RiverZ4–12.7609
    Z5–11.0840
    Xiaoqing RiverZ8–18.4398
    Mihe RiverZ9–12.8650
    Bailang RiverZ10–3.5441
    Y=–5.3167 (average value of neritic sediment)
    Y=–10.4418 (average value of fluvial deposit)
     | Show Table
    DownLoad: CSV
    Figure 4.  Vertical distribution of the parameter discriminant value in eight cores.

    The values (−32.18, −22.74, and −35.14) of column cores (Z13, Z1, and Z6) in delta lateral were lower than the average fluvial deposit (−10.44). It appeared an extreme value (Y> −7.419) at a depth of 80 cm (Z1), indicating that the Yellow River was once a short cut (Fig. 4a). Close to fluvial deposit values, Z4 and Z5 changed in fluvial and neritic sediment, indicating that it is related to the north tidal flat which used to be the channel of the Yellow River entering the Bohai Sea (1897–1904, 1929–1934) and then the river flowed north (Fig. 4b). The calculated value (Z8, Z9, and Z10) according to 13 cores in Eq. (1) was close to fluvial deposit values, but it changed under 80 cm in Z8 indicating that the sediment transported of coastal rivers (such as the Xiaoqing River, the Mihe River) (Fig. 4c).

    The sedimentary accumulation curve can explain the relationship between sediment size and transport mode (Saito Y, 2010). C-M patterns were proposed by Passega as a geological tool (Passega R, 1964), which can reflect the relationship between the maximum size and the median size (Fig. 5). The grain size distributions are used for the analysis of sedimentary dynamics which is used for studying hydrodynamic conditions during sedimentary processes although the result is unambiguous, while the picture in Fig. 5 is open to interpretation. Among these, C is the particle size corresponding to 1% content on the accumulation curve, representing the maximum energy (Initial Energy) when the hydrodynamic starts to transport sediments. M is the particle size corresponding to 50% content on the cumulative curve, representing the average energy (Average Energy) of hydrodynamic forces. The results showed that the value of M remained unchanged whereas C changed significantly, indicating the average energy source was relatively stable under the initial energy changing in lateral of the modern Yellow River estuary. It could be explained that the northern tidal of the Guangli estuary had homogenous suspension characteristics by C, M relatively concentrated, and initial and average energy stable. The values of C and M in the southern Laizhou Bay were roughly equivalent and had both the characteristics of the homogenous and graded suspension. C and M in the central shallow sea area changed greatly, indicating that the initial and average water energy changed significantly.

    Figure 5.  The C-M diagrams of sedimentary column sampling in western Laizhou Bay. Eight sedimentary segments (Ⅰ–Ⅷ) and five sedimentary graph sections (NO, OP, PQ, QR and RS) by C and M. RS–homogenous suspension; QR–graded suspension; PQ–dominated by suspended deposition; OP–mainly rolling transportion mixed with suspension; NO–rolling transportion.

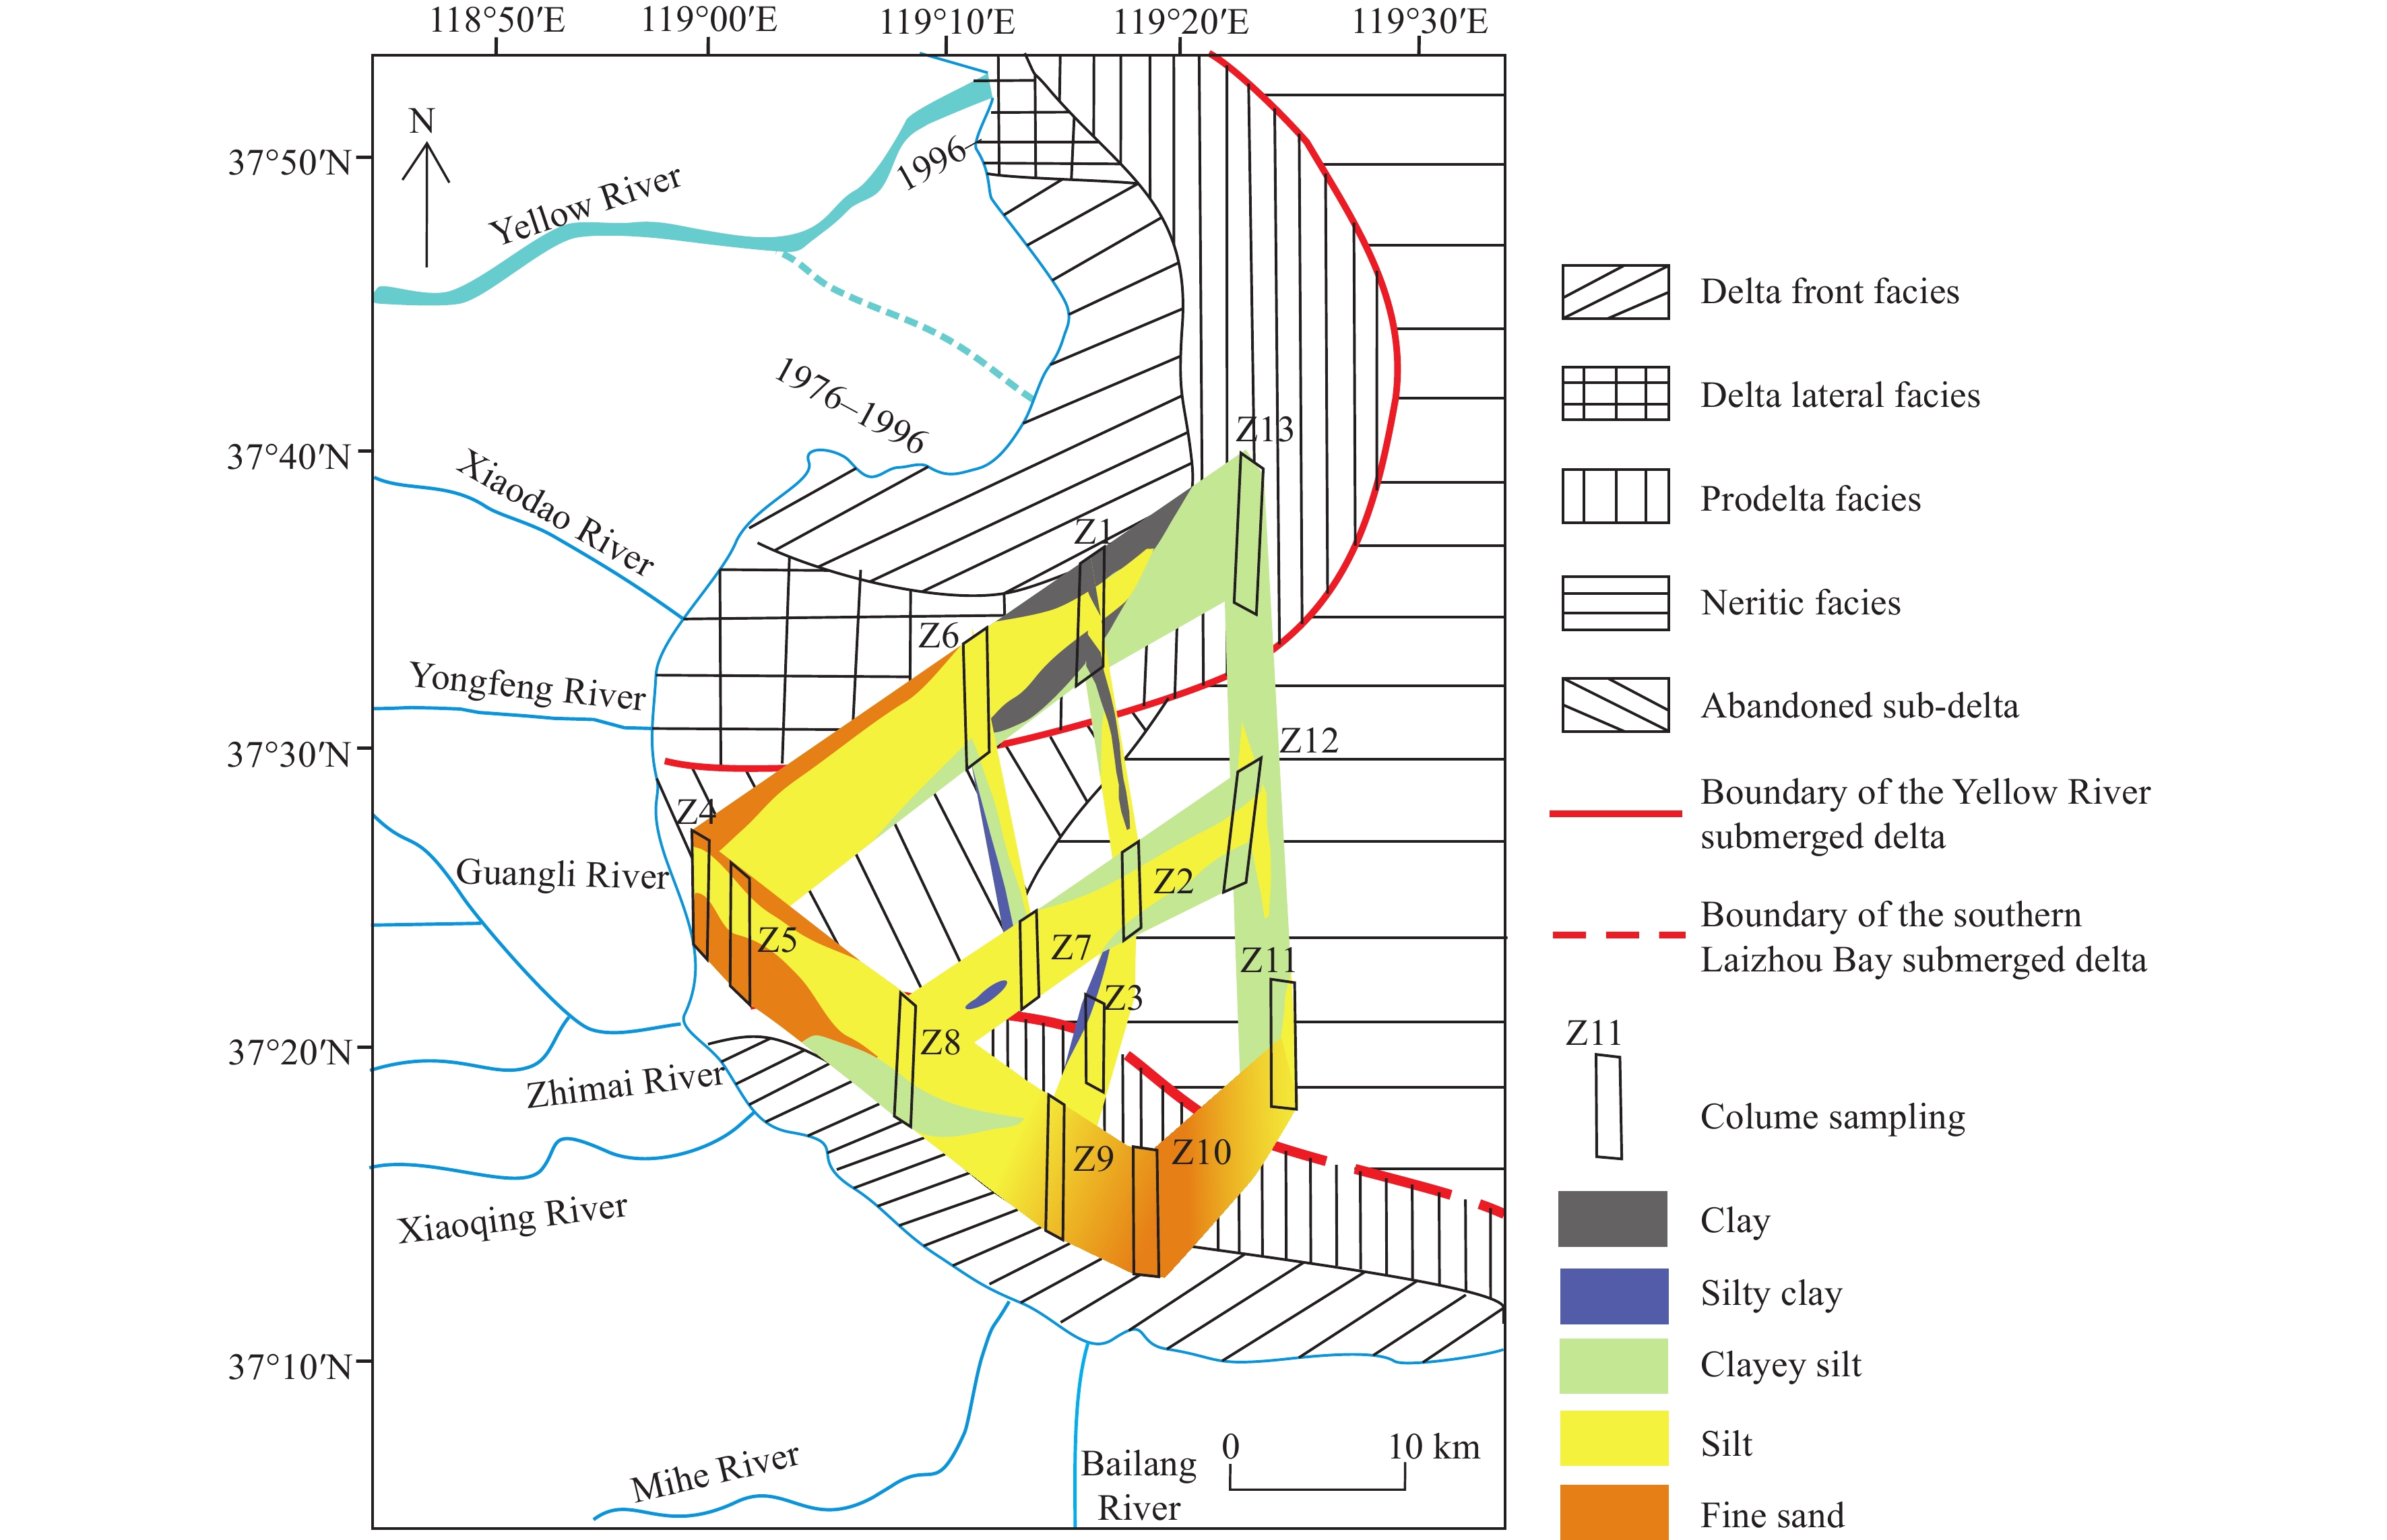
    Grain characteristics and accumulation curves are usually used to distinguish and classify the sedimentary environment. The sedimentary records are constructed by the frequent oscillations of diversion channels, sedimentary, and erosion interaction characteristics in this study. The sedimentary distribution patterns were reconstructed to identify the sedimentary evolution characteristics in the western Laizhou Bay (Fig. 6).

    Figure 6.  The fence diagrams and sedimentary facies model in Western Laizhou Bay, China (Modified from Cheng GD and Xue CT, 1997; Xue CT and Ding D, 2008).

    In the northern section (“Z4-Z6-Z1-Z13”), sediment changed from silty sand and silt to clayey silt. The distribution of clay silt was relatively concentrated in the weak sedimentary dynamic area (lateral delta). This suggested the subaqueous delta overlapped during five diversions of the Yellow River (1897–1904, 1929–1934, 1938–1947, 1947–1953, 1976–1996) and the sedimentary environment change (north tidal flat-abandoned subaqueous delta-lateral delta-delta front).

    In the southern section (“Z5-Z8-Z9-Z10”), sediments changed from the interphase of silty sand and clayey silt to the upper coarse and lower fine (in the upper segment), and gradually coarse (the lower segment, from clayey silt to silty sand). The southern sediments came from different multi-source rivers under the influence of the Xiaoqing River, the Mihe River, and other coastal rivers.

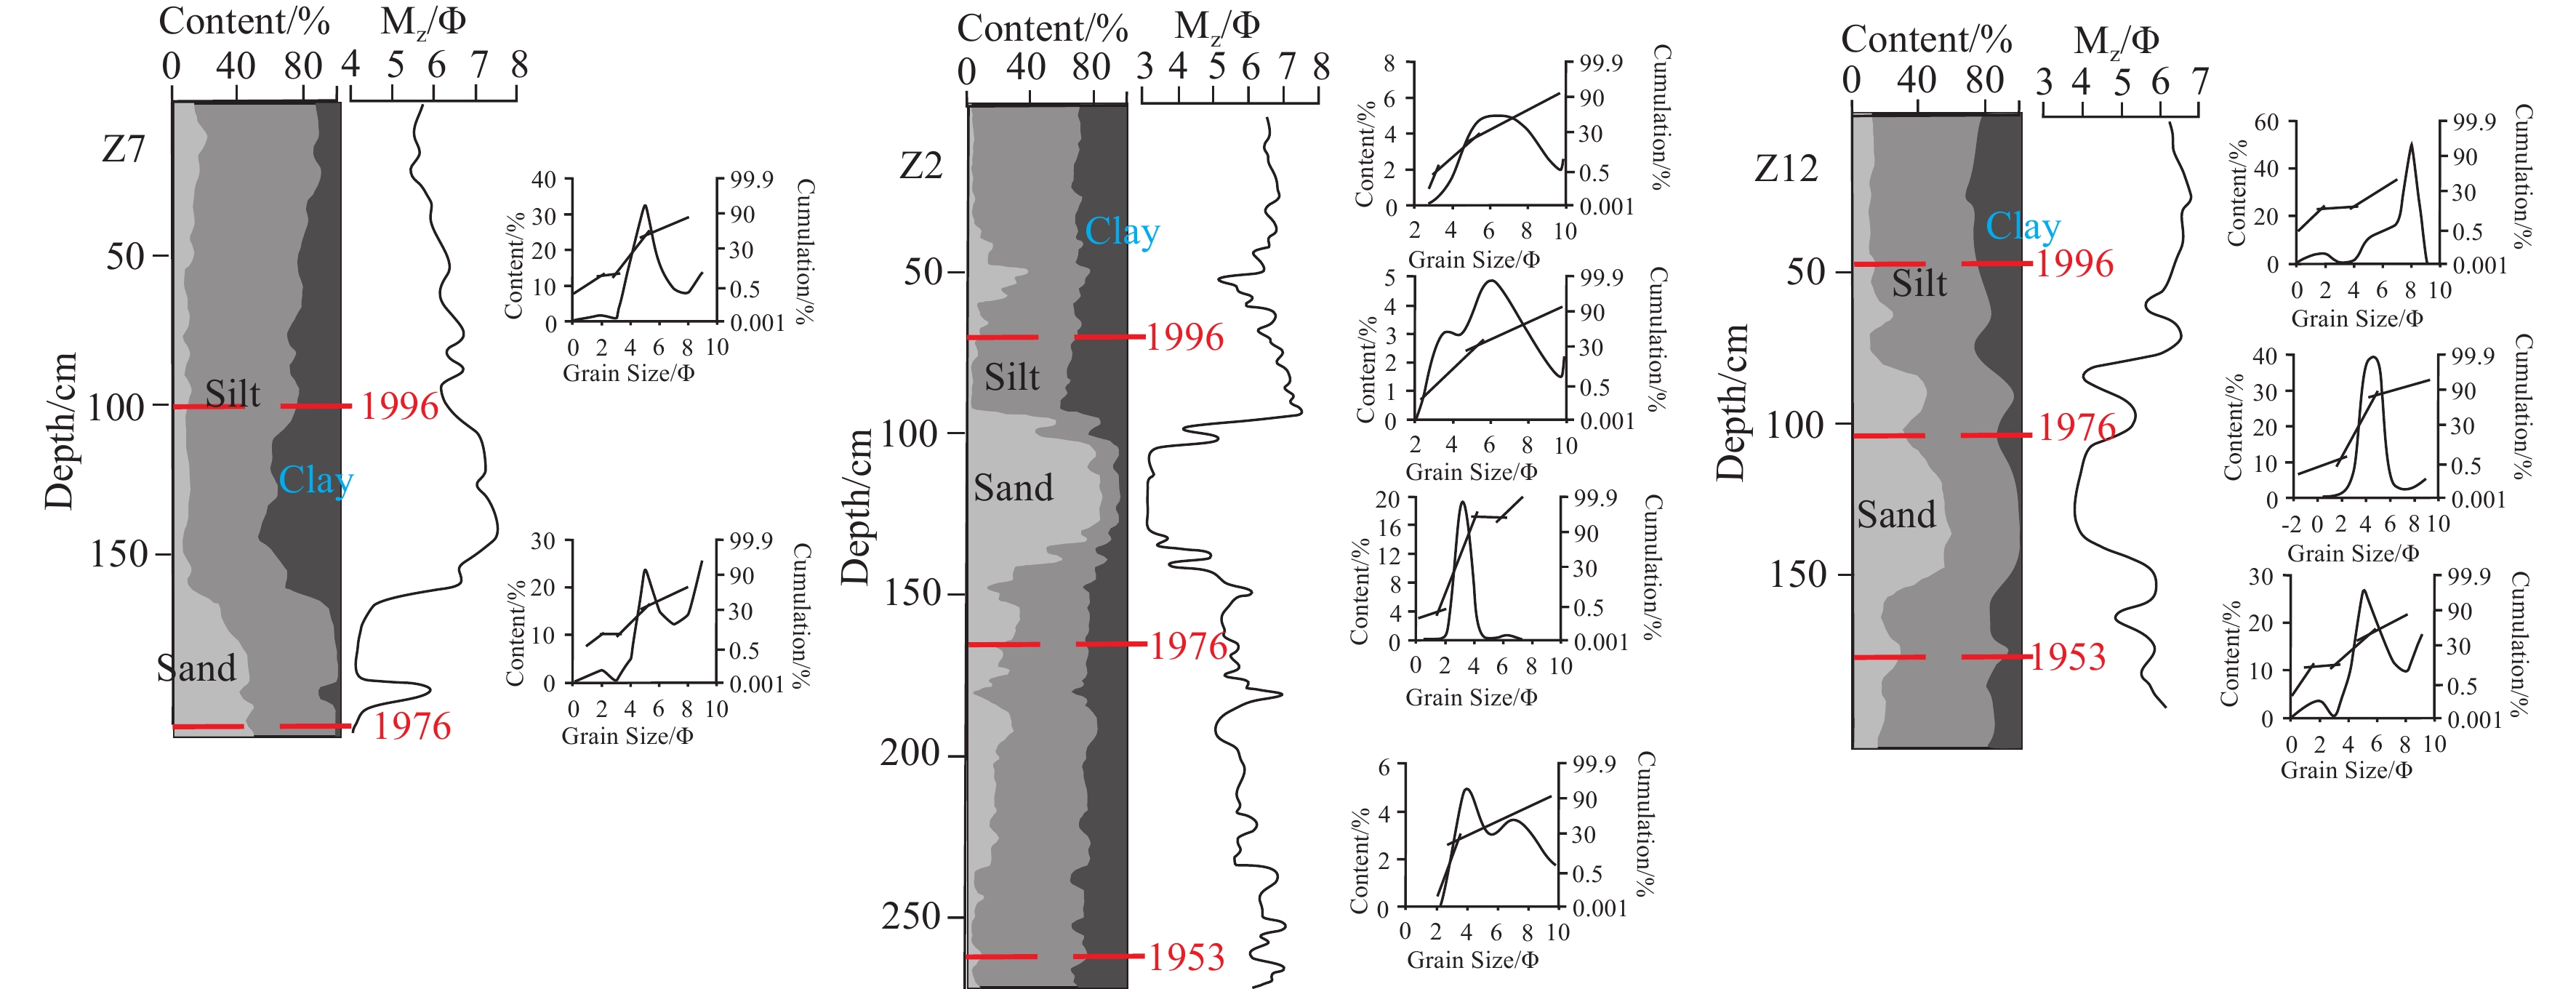
    Clays’ content increased from Xiaoqing estuary to central of Laizhou Bay (“Z8-Z7-Z2-Z12”), but the sand content increased at 80–150 cm depth. The frequency curve had 2–3 peaks with a sharp negative skewness showing sedimentary source diversity. The probabilistic accumulation curve mostly consisted of three phases (“Z7-Z2-Z12”), with transitions from shift to suspension, reflecting a complex and varied sedimentary dynamics environment in the central shallow sea (Fig. 7).

    Figure 7.  Vertical distribution of the grain size and cumulative relative curve in the shallow sea.

    The Yellow River entered the Bohai Sea from the northern tidal area at the Guangli estuary in 1897–1904 and 1929–1934 (Fig. 8a). At that time, the river’s location was south of the modern Yellow River, and the Guangli River had not yet developed. Bounded by the Guangli River, deposited sediment characteristics in the north were mainly affected by the Yellow River, and the south by the Xiaoqing River, Mihe River, and other coastal rivers.

    Figure 8.  Diversions of the Yellow River and sedimentary area of coastal rivers within 100 years. a–the Yellow River diversion at Guangli estuary (1897–1904 and 1929–1934); b–the Yellow River diverted to north in three strands (1934–1938 and 1947–1953), and a new sediment area forming (Guangli River as a separate distributary); c–the Yellow River flowed to Qingshui Ditch, and the sediment area spread (1976–1996).

    After 1934, the Yellow River was diverted to the north in three strands (1934–1938 and 1947–1953), and the Guangli River became a separate distributary that reconstructed the sedimentary environment (Fig. 8b). The sediment in the western Laizhou Bay was shown as follows: The northern area was directly affected by the Yellow River, the central part was transformed by the Guangli River, and the southern part was affected by the Xiaoqing and Mihe rivers.

    From 1976 to 1996, the Yellow River changed its course to flow into the sea from the Qingshui Ditch, and the sediment diffused from the north to south spread (Fig. 8c).

    Artificial diversions of the Yellow River to the north-northeast followed in 1996 (Zhou LY et al., 2016). The range of influence of the rivers was further expanded in the west Laizhou Bay, represented by the Guangli River and Zimai Ditch. However, the influence of coastal rivers such as the Guangli River, Yongfeng River, and Xiaodao River on the sedimentary environment was limited to coastal areas only.

    Bounded by the Guangli estuary, the northern sediment was affected by water and sand flowing from the Yellow River during different periods. The formed subaqueous deltas overlapped and changed the sedimentary environment. The southern sediments came from different multi-source rivers under the influence of the Xiaoqing River, Mihe River, and other coastal rivers.

    So the dating (1976 and 1996) in Z1, Z6, and Z13 (Fig. 4a), dating (1934) in Z4 and Z5 (Fig. 4b), and dating (1980) in Z1, Z6, and Z13 (Fig. 4c) was clearly recorded by the diversion channel combined with the characteristics of grain size, accumulation curve, erosion, and regression. The dating (1953, 1976, and 1996) in the core (Z7, Z2, and Z12) was recorded by the diversion channel combined with sediment accumulation rates from the delta front to the prodelta (Fig. 7; Li J et al., 2002). The deposited sedimentary characteristics in the western Laizhou Bay kept a dynamic balance due to the superimposed effect of multiple rivers along the coast.

    The sedimentary evolution in the west of Laizhou Bay was restricted by the sediment condition of the Yellow River, the interaction between the small and medium rivers, and the ocean hydrodynamics. On the other hand, human activities play an important role in the evolution of the sedimentary environment in west Laizhou Bay.

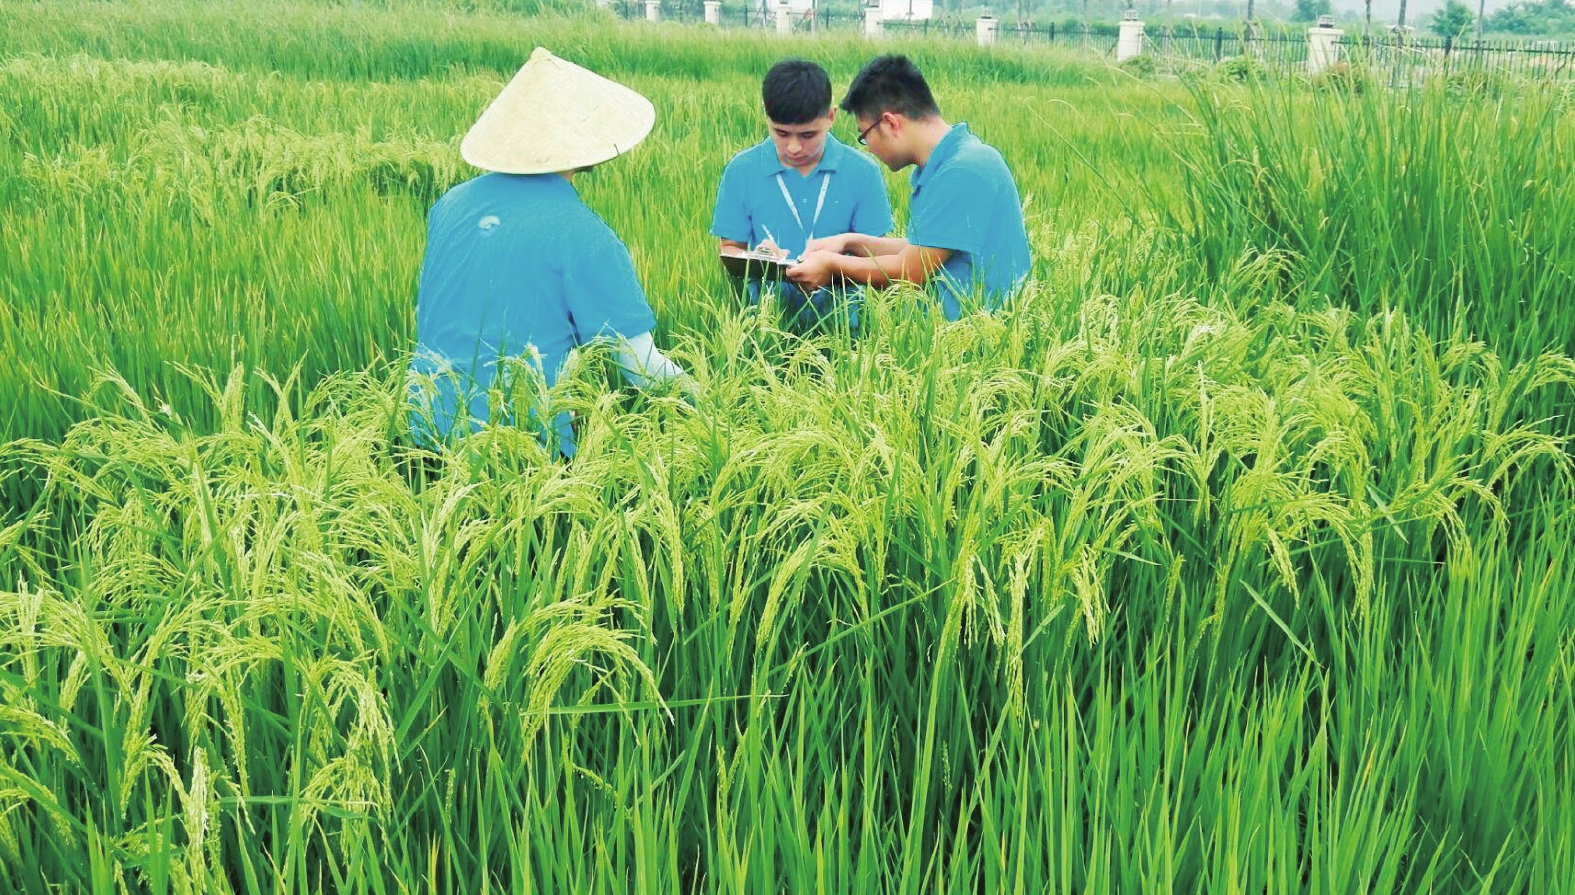
    Since 2002, the Water and Sediment Regulation of the Yellow River has accelerated the change of the sedimentary environment in the south of the modern estuary. At present, the north tidal flat of the Guangli River estuary in this research area is basically balanced, the salinity of tidal flat is effectively controlled, and the reclamation area is expanded, forming a sedimentary environment conducive to local aquaculture and sea rice cultivation. Since 2013, the team of Academician Long-ping Yuan has carried out the research and development of new varieties of sea rice in the reclamation area of Dongying in Shandong Province by using the tidal flat with medium salinity, and established 1000 acre planting demonstration base, which has become an important growth point of the local economy (Pan JQ, 2018; Fig. 9). In 2020, the planting area of super hybrid rice will be expanded to over 10000 acres in saline-alkali soil of Shandong Province (http://m.mnr.gov.cn/dt/hy/202003/t20200313_2501409.html). At the same time, the scale and production of characteristic aquacultures, such as Yellow River estuary hairy crabs, which are adapted to the local sedimentary environment, continue to increase.

    Figure 9.  Sea rice of saline-alkali soil in Shandong coastal (after Pan JQ, 2018).

    The sediment of the western Laizhou Bay mainly originates from the modern Yellow River, multi-source coastal rivers, and other coastal erosion. Mainly the Yellow River substance, and other coastal rivers merely play a sedimentary reconstruction role in the western Laizhou Bay.

    Deposited sediments mainly include the lateral margin of the modern Yellow River estuary, the north tidal area of the Guangli River estuary, the southern area of Laizhou Bay, and the central shallow sea area. There are sediment environment evolutions, however, that can be revealed only by studying their branched diversions of the Yellow River and coastal multi-rivers. And the sedimentary records of the past one hundred years have been reconstructed.

    Dating of the northern estuary sediment is determined by a clear historical record of the branched channel oscillation (the Yellow River) combined with the characteristics of river diversion, erosion, and regression.

    Mao-sheng Gao and Guo-hua Hou conceived of the presented idea. Mao-sheng Gao and Xue-yong Huang developed the environment evolution theory and performed the computations. Xue-yong Huang and Xian-zhang Dang verified the grain size analytical methods. Mao-sheng Gao encouraged Guo-hua Hou and Xue-yong Huang to investigate sedimentary distribution characteristic and supervised the findings of this work. All authors discussed the results and commented on the manuscript.

    The authors declare no conflict of interest.

    This research was funding by the National Natural Science Foundation of China (41977173), Ministry of Science and Technology of the People’s Republic of China (2016YFC0402801), and the China Geological Survey Project (DD20189503). The data were mainly provided by the CROWN sites. The authors thank Prof. Dong-yan Liu and Qiu-ying Han from Yantai Institute of Coastal Zone Research, Chinese Academy of Sciences for their help in collecting field data and conducting the geological survey.

  • [1] Bi NS, Wang HJ, Yang ZS. 2014. Recent changes in the erosion-accretion patterns of the active Huanghe (Yellow River) delta lobe caused by human activities. Continental Shelf Research, 90, 70–78. doi: 10.1016/j.csr.2014.02.014

    CrossRef Google Scholar

    [2] Cheng GD, Ren YC, Li SQ. 1986. Channel evolution and sedimentary sequence of modern Huanghe River delta. Marine Geology and Quaternary Geology, 2, 1–15 (in Chinese with English abstract). doi: 10.16562/j.cnki.0256-1492.1986.02.001

    CrossRef Google Scholar

    [3] Cheng GD, Xue CT. 1997. The Yellow River Delta Sedimentary Geology. Beijing, Geological Press, 73-83 (in Chinese).

    Google Scholar

    [4] Cui BL, Li XY. 2011. Coastline change of the Yellow River estuary and its response to the sediment and runoff (1976–2005). Geomorphology, 127, 32–40. doi: 10.1016/j.geomorph.2010.12.001

    CrossRef Google Scholar

    [5] Folk RL, Andrews PB, Lewis DW. 1970. Detrital sedimentary rock classification and nomenclature for use in New Zealand. Journal of Geology and Geophysics, 13, 937–968. doi: 10.1080/00288306.1970.10418211

    CrossRef Google Scholar

    [6] Folk RL, Ward WC. 1957. Brazos River bar: A study in a significance of grain size parameters. Journal of Sedimentary Research, 27, 2–26. doi: 10.1306/74D70646-2B21-11D7-8648000102C1865D

    CrossRef Google Scholar

    [7] Gao MS, Guo F, Huang XY. 2019. Sediment distribution and provenance since Late Pleistocene in Laizhou Bay, Bohai Sea. China Geology, 1, 16–25. doi: 10.31035/cg2018062

    CrossRef Google Scholar

    [8] Hatten JA, Goñi MA, Wheatcroft RA. 2012. Chemical characteristics of particulate organic matter from a small mountainous river system in Oregon Coast Range, USA. Biogeochemistry, 107, 43–66. doi: 10.1007/s10533-010-9529-z

    CrossRef Google Scholar

    [9] Hsiung KH, Saito Y. 2017. Sediment trapping in deltas of small mountainous rivers of southwestern Taiwan and its influence on East China Sea sedimentation. Quaternary International, 455, 30–44. doi: 10.1016/j.quaint.2017.02.020

    CrossRef Google Scholar

    [10] Kremer HH. 2004. River catchment-coastal sea interaction and human dimensions. Regional Environmental Change, 4, 1–4. doi: 10.1007/s10113-003-0066-3

    CrossRef Google Scholar

    [11] Kuehl SA, Nittrouer CA, Allison MA, Faria L, Dukat DA, Jaeger JM, Pacioni TD, Figueiredo AG, Underkoffler EC. 1996. Sediment deposition, accumulation, and seabed dynamics in an energetic fine grained coastal environment. Continent Shelf Research, 16, 787–815. doi: 10.1016/0278-4343(95)00047-X

    CrossRef Google Scholar

    [12] Li J, Hu BQ, Dou YG, Zhao JT, Li GG. 2002. Modern sedimentation rate, budget and supply of the muddy deposits in the east China seas. Geological Review, 58, 745–756 (in Chinese with English abstract). doi: 10.16509/j.georeview.2012.04.010

    CrossRef Google Scholar

    [13] Li T, Li TJ. 2018. Sediment transport processes in the Pearl River Estuary as revealed by grain-size end-member modeling and sediment trend analysis. Geo-Marine Letters, 38, 167–178. doi: 10.1007/s00367-017-0518-2

    CrossRef Google Scholar

    [14] Liu JP, David JD, Charles AN. 2017. A seismic study of the Mekong subaqueous delta: Proximal versus distal sediment accumulation. Continental Shelf Research, 147, 197–212. doi: 10.1016/j.csr.2017.07.009

    CrossRef Google Scholar

    [15] Mcmanus J. 1988. Grain size determination and interpretation. Techniques in Sediment, 3, 33–48.

    Google Scholar

    [16] Palinkas CM, Nittrouer CA. 2007. Modern sediment accumulation on the Po shelf, Adriatic Sea. Continent Shelf Research, 27, 489–505. doi: 10.1016/j.csr.2006.11.006

    CrossRef Google Scholar

    [17] Pan JQ. 2018. Planting the saline-alkali land into smart farmland by sea rice. Rural Agriculture and Farmer, 8, 27–28.

    Google Scholar

    [18] Pang JZ, Jiang MX. 2003. On the evolution of the Yellow River estuary. Transactions of Oceanology and Limnology, 4, 1–13 (in Chinese with English abstract). doi: 10.13984/j.cnki.cn37-1141.2003.03.001

    CrossRef Google Scholar

    [19] Passega R. 1964. Grain size representation by C-M patterns as a geologic tool. Journal of Sedimentary Research, 34, 830–847. doi: 10.1306/74d711a4-2b21-11d7-8648000102c1865d

    CrossRef Google Scholar

    [20] Peng J, Chen SL. 2009. The variation process of water and sediment and its effect on the Yellow River Delta over the six decades. Acta Geographica Sinica, 64(11), 1353–1362 (in Chinese with English abstract). doi: 10.11821/xb200911007

    CrossRef Google Scholar

    [21] Qiao SQ, Shi XF, Saito Y. 2011. Sedimentary records of natural and artificial Huanghe (Yellow River) channel shifts during the Holocene in the southern Bohai Sea. Continental Shelf Research, 31, 1336–1342. doi: 10.1016/j.csr.2011.05.007

    CrossRef Google Scholar

    [22] Qin YS, Zhao YY, Zhao SL. 1985. Geology of the Bohai Sea. Beijing, Science Press, 31–49 (in Chinese).

    Google Scholar

    [23] Sahu BK. 1964. Depositional mechanisms from the size analysis of clastic sediments. Journal of Sedimentary Petrology, 34, 73–83. doi: 10.1306/74D70FCE-2B21-11D7-8648000102C1865D

    CrossRef Google Scholar

    [24] Saito Y. 2010. Basic patterns of the fine grained sediments on the C-M diagram. Journal of the Sedimentological Society of Japan, 22, 54–64.

    Google Scholar

    [25] Wang F, Li JF, Shi PX, Shang ZW, Li Y, Wang H. 2019. The impact of sea-level rise on the coast of Tianjin-Hebei, China. China Geology, 1, 26–39. doi: 10.31035/cg2018061

    CrossRef Google Scholar

    [26] Wang HJ, Yang ZS, Li GX. 2006. Wave climate model on the abandoned Huanghe (Yellow River) delta lobe and related deltaic erosion. Journal of Coastal Research, 22, 906–918. doi: 10.2112/03-0081.1

    CrossRef Google Scholar

    [27] Wheatcroft RA, Goni MA, Hatten JA. 2010. The role of effective discharge in the ocean delivery of particulate organic carbon by small, mountainous river systems. Limnology and Oceanography, 55, 161–171. doi: 10.4319/lo.2010.55.1.0161

    CrossRef Google Scholar

    [28] Xue CF, Jia JJ, Gao S. 2018. The contribution of middle and small rivers to the distal mud of subaqueous Chang Jiang Delta: Results from Jiaojiang River and Oujiang River. Acta Oceanologica Sinica, 40, 75–89 (in Chinese with English abstract). doi: 10.3969/j.issn.0253-4193.2018.05.007

    CrossRef Google Scholar

    [29] Xue CT, Ding D. 2008. Weihe River-Mihe River delta in south coast of Bohai Sea, China: Sedimentary sequence and architecture. Scientia Geographica Sinica, 5, 672–676 (in Chinese with English abstract). doi: 10.13249/j.cnki.sgs.2008.05.005

    CrossRef Google Scholar

    [30] Xue CT, Ye SY, Gao MS. 2009. Determination of depositional age in the Huanghe Delta in China. Acta Oceanologica Sinica, 31, 117–124 (in Chinese with English abstract). doi: 10.3321/j.issn:0253-4193.2009.01.015

    CrossRef Google Scholar

    [31] Yang HR, Wang J. 1990. Quaternary transgressions and coastline changes in Huanghe River delta. Marine Geology and Quaternary Geology, 3, 1–14 (in Chinese with English abstract). doi: 10.16562/j.cnki.0256-1492.1990.03.001

    CrossRef Google Scholar

    [32] Yang RM, Li GX, Li AL. 2005. Studies on sedimentary characteristics and process of erosion-accumulation of Guangli River mouth bar. Periodical of Ocean University of China, 35, 339–343 (in Chinese with English abstract). doi: 10.16441/j.cnki.hdxb.2005.02.034

    CrossRef Google Scholar

    [33] Ye QH, Chen SL, Huang C. 2007. Characteristics of landscape information Tupu of the Yellow River swings and its subdeltas during 1855–2000. Science in China Series D: Earth Sciences, 50, 1566–1577. doi: 10.1007/s11430-007-0056-2

    CrossRef Google Scholar

    [34] Yin P, Duan XY, Gao F, Li MN, Lü SH, Qiu JD, Zhou LY. 2018. Coastal erosion in Shandong of China: Status and protection challenges. China Geology, 1, 512–521. doi: 10.31035/cg2018073

    CrossRef Google Scholar

    [35] Yu Z, Wu S, Zou D, Feng D, Zhao H. 2008. Seismic profiles across the middle Tan-Lu fault zone in Laizhou Bay, Bohai Sea, Eastern China. Journal of Asian Earth Science, 33, 383–394. doi: 10.1016/j.jseaes.2008.03.004

    CrossRef Google Scholar

    [36] Zhang J. 2011. On the critical issues of land-ocean interactions in the coastal zones. Chinese Science Bulletin, 56, 1956–1966 (in Chinese with English abstract). doi: 10.1360/972011-465

    CrossRef Google Scholar

    [37] Zhou LY, Liu JP, Saito Y. 2016. Modern sediment characteristics and accumulation rates from the delta front to prodelta of the Yellow River (Huanghe). Geo-Marine Letters, 36, 247–258. doi: 10.1007/s00367-016-0442-x

    CrossRef Google Scholar

  • Related articles

    [1] Mao-sheng Gao, Fei Guo, Xue-yong Huang, Guo-hua Hou. Sediment distribution and provenance since Late Pleistocene in Laizhou Bay, Bohai Sea, China. China Geology, 2019, 2(1): 16-16. doi: 10.31035/cg2018062
    [2] Yong Zhang, Bin Chen, Ze Ning, Yun-fan Yang, Gang Hu, Xiao-bo Zhang, Hou-jie Wang. Investigation and numerical simulation of summer sedimentation in Jiaozhou Bay, China. China Geology, 2019, 2(4): 522-522. doi: 10.31035/cg2018090
    [3] Wen-yu Wang, Chang-fu Fan, Zhao-jun Song, Hong Wang, Fu Wang. Pacific oyster (Crassostrea gigas) shell growth duration in a year in Bohai Bay and implication for its carbon sink potential. China Geology, 2024, 7(4): 653-653. doi: 10.31035/cg2023054
    [4] Zhi-wen Shang, Jian-fen Li, Holger Freund, Pei-xin Shi, Hong Wang. Quantitative relationship between surface sedimentary diatoms and water depth in North-Central Bohai Bay, China. China Geology, 2023, 6(1): 61-61. doi: 10.31035/cg2022040
    [5] Yong Li, Ming-zheng Wen, Heng Yu, Peng Yang, Fei-cui Wang, Fu Wang. Changes of coastline and tidal flat and its implication for ecological protection under human activities: Take China's Bohai Bay as an example. China Geology, 2024, 7(1): 26-26. doi: 10.31035/cg2023007
    [6] Hong-xian Chu, Sai Mei, Xiao-hui Gao, Zhong-hua Fang, Jing Feng. Analysis of formation and slope stability in Caofeidian Channel in Bohai Bay. China Geology, 2019, 2(2): 189-189. doi: 10.31035/cg2018057
    [7] Jun He, Tong Feng, Liang Tao, Yue-e Peng, Lei Tong, Xin-wen Zhao, Xin Shao, Lin-ya Xu, Yan-lin Yang, Yong-bo Zhao. Distribution and impacts on the geological environment of antiviral drugs in major waters of Wuhan, China. China Geology, 2022, 5(3): 402-402. doi: 10.31035/cg2022047
    [8] Zhen-yu Lei, Li Zhang, Ming Su, Shuai-bing Luo, Xing Qian, Bo-da Zhang. Types, characteristics and implication for hydrocarbon exploration of the Middle Miocene deep-water sediments in Beikang Basin, southern South China Sea. China Geology, 2019, 2(1): 85-85. doi: 10.31035/cg2018094
  • 1.  Hao, X., Lao, Y., Ouyang, X. et al. Late Pliocene(6.8-0.004 Ma)vegetation evolution and sea-level fluctuations on the southern coastal plain of Laizhou Bay, Bohai Sea, China | [山东莱州湾南岸晚上新世以来(6.8~0.004 Ma)古植被演替与海平面波动]. Geology in China, 2024, 51(2): 689-700.
    2.  Sun, J., Peng, L., Zhu, X. et al. The effects of changes in the coastline and water depth on tidal prism and water exchange of the Laizhou Bay, China. Frontiers in Marine Science, 2024, 11: 1459482.
    3.  Sun, Q., Gao, M., Wen, Z. et al. Reactive transport modeling for the effect of pumping activities on the groundwater environment in muddy coasts. Journal of Hydrology, 2023, 621: 129614.
    4.  Wang, F., Wang, H., Li, J. et al. Evolution and trending prediction of the Chinese mainland coasts since 20 ka BP: Implication for ecological protection and restoration | [中国海岸20 ka以来的演替过程及趋势分析:对现代海岸生态保护修复的启示]. Geology in China, 2023, 50(1): 61-83.
    5.  Sun, Q., Gao, M., Wen, Z. et al. Hydrochemical evolution processes of multiple-water quality interfaces (fresh/saline water, saline water/brine) on muddy coast under pumping conditions. Science of the Total Environment, 2023, 857: 159297.
    6.  Zhou, P., Ye, S., Wang, J. et al. Glomalin-related soil protein distribution and its relation to mineral weathering in the wetlands along the Bohai Sea, China | [环渤海湿地沉积物球囊霉素相关土壤蛋白分布特征及其对湿地土壤风化的影响]. Geology in China, 2022, 49(4): 1075-1087.
    7.  Chen, S.-M., Liu, H.-W., Liu, F.-T. et al. Using time series analysis to assess tidal effect on coastal groundwater level in Southern Laizhou Bay, China. Journal of Groundwater Science and Engineering, 2022, 10(3): 292-301.

    Other cited types(0)

  • 加载中
通讯作者: 陈斌, bchen63@163.com
  • 1. 

    沈阳化工大学材料科学与工程学院 沈阳 110142

  1. 本站搜索
  2. 百度学术搜索
  3. 万方数据库搜索
  4. CNKI搜索

Figures(9)

Tables(3)

Article Metrics

Article views(1808) PDF downloads(10) Cited by(7)

Access History

Catalog

    /

    DownLoad:  Full-Size Img  PowerPoint
    • Table 1.  Location and sample records of 13 columnar deposits in the western Laizhou Bay.
      SampleLongitude/
      N
      Latitude/
      E
      Water depth/mLength/
      cm
      Sampling time
      Z1119°10′34″37°31′53″6250Aug-Nov, 2013
      Z2119°10′19″37°23′47″8268Aug-Nov, 2013
      Z3119°10′07″37°18′21″4306Aug-Nov, 2013
      Z4118°55′47″37°25′22″0120Sep-14, 2015
      Z5118°56′57″37°23′47″0108Sep-14, 2015
      Z6119°05′53.27″37°30′00.51″5203Jul-Dec, 2015
      Z7119°05′59.40″37°21′46.42″5191Jul-Dec, 2015
      Z8119°04′00.90″37°19′39.86″2142Jul-Dec, 2015
      Z9119°09′12.02″37°16′28.72″4100Jul-Dec, 2015
      Z10119°14′02.98″37°14′11.60″2115Jul-Dec, 2015
      Z11119°17′10.39″37°18′15.42″6159Jul-Dec, 2015
      Z12119°16′39.70″37°24′56.54″8190Jul-Dec, 2015
      Z13119°16′17.05″37°33′38.26″9101Jul-Dec, 2015
       | Show Table
      DownLoad: CSV
    • Table 2.  Statistics result of the main parameter in core samples.
      SiteCoreValueSand/%Silt/%Clay/%MzSoSkKgWater depth/mSource
      Delta lateralZ1Max61.0379.4442.517.591.920.531.96–4– –8Yellow River
      Min038.9703.590.610.050.85
      Average14.1466.1319.735.8041.590.311.18
      Z6Max35.7174.2934.446.772.400.461.65
      Min7.8351.1610.025.041.65–0.410.80
      Average15.8065.8318.365.792.020.141.05
      Z13Max26.7674.2912.465.381.680.481.97
      Min13.9066.734.374.361.060.161.19
      Average19.1170.7010.195.131.560.411.38
      North tidalZ4Max66.3886.6814.245.631.740.481.760– –4Guangli estuary
      Min5.6932.470.083.480.600.040.96
      Average21.1972.885.934.581.160.281.45
      Z5Max48.7572.1512.735.221.840.461.88
      Min18.5248.582.223.790.620.101.05
      Average32.9962.344.674.191.070.301.62
      Southern sectionZ3Max77.3178.8939.377.422.250.632.25–2– –6Xiaoqing River, Mihe River
      Min0.2322.6903.340.51–0.120.73
      Average41.8148.589.614.521.240.211.13
      Z8Max63.4366.3433.586.832.180.551.86
      Min5.4731.842.473.870.86–0.360.61
      Average42.3846.4911.134.721.410.181.29
      Z11Max60.2166.6829.507.542.170.402.11
      Min6.1739.7904.840.65–0.260.65
      Average40.5552.466.995.451.160.111.25
      Z9Max64.3262.7426.916.062.950.311.81
      Min19.2835.6803.790.68–0.430.80
      Average44.4750.634.914.271.09–0.031.05
      Z10Max75.4742.0603.890.750.091.23
      Min57.9424.5303.650.66–0.020.79
      Average66.0233.9803.780.710.050.98
      The centralZ2Max89.5376.3440.527.492.450.622.63–6– –8All rivers
      Min010.4703.110.50–0.160.71
      Average23.0655.1121.825.761.850.220.97
      Z7Max48.5373.3749.637.602.080.472.06
      Min5.2245.1504.010.65–0.570.65
      Average16.5960.7722.645.921.65–0.061.01
      Z12Max58.1791.4436.076.842.440.481.77
      Min8.5641.8303.880.72–0.640.67
      Average25.2257.9016.885.501.770.030.98
       | Show Table
      DownLoad: CSV
    • Table 3.  Identification values of neritic sediment and fluvial deposit.
      Coastal riverCoreY
      Yellow RiverZ13–32.1887
      Z1–22.7472
      Z6–35.1430
      Guangli RiverZ4–12.7609
      Z5–11.0840
      Xiaoqing RiverZ8–18.4398
      Mihe RiverZ9–12.8650
      Bailang RiverZ10–3.5441
      Y=–5.3167 (average value of neritic sediment)
      Y=–10.4418 (average value of fluvial deposit)
       | Show Table
      DownLoad: CSV