Yang-sen Yuan, Shui-ping Li, Jun Peng, Jian-tao Si, Hua Cheng, Jin Sun, Jian-zheng Wei, Jiang-bo Shao, 2019. An integrated ore prospecting model for the Nyasirori gold deposit in Tanzania, China Geology, 2, 407-421. doi: 10.31035/cg2018127
Citation: Yang-sen Yuan, Shui-ping Li, Jun Peng, Jian-tao Si, Hua Cheng, Jin Sun, Jian-zheng Wei, Jiang-bo Shao, 2019. An integrated ore prospecting model for the Nyasirori gold deposit in Tanzania, China Geology, 2, 407-421. doi: 10.31035/cg2018127

An integrated ore prospecting model for the Nyasirori gold deposit in Tanzania

More Information
  • The Nyasirori gold deposit, located in the middle-western end of the Musoma-Mara Archean greenstone belt in Tanzania, is a tectonic altered rock type gold deposit controlled by shear tectonic zone. This work conducted high-precision ground magnetic measurements to delineate fault structures and favorable prospecting targets, utilized induced polarization (IP) intermediate gradient to roughly determine the distribution and extension of the tectonic altered zone and gold ore (mineralized) bodies, and further carried out IP sounding and magnetotelluric sounding to locate the tectonic altered zone and gold ore (mineralized) bodies. The anomalous gradient belt of the combination of positive and negative micromagnetic measurements reflects the detail of shallow surface tectonic alteration zone and gold mineralization body. Micromagnetic profile anomalies indicate the spatial location and occurrence of concealed tectonic alteration zone and gold (mineralized) ore bodies. Soil geochemical measurements indicate that the ore-forming element Au correlates well with As and Sb, and As and Sb anomalies have a good indication to gold orebodies. Based on the multi-source geological-geophysical-geochemical information of the Nyasirori gold deposit, this work established an integrated prospecting model and proposed a set of geophysical and geochemical methods for optimizing prospecting targets.

  • Individual prospecting method is not effective to discover concealed or difficult-identified ores, and thus comprehensive multi-disciplinary prospecting methods have been popular in ore exploration (Pei RF et al., 2013; Jiang SQ et al., 2014; Yang J et al., 2014; Wang DB et al., 2016; Chen W et al., 2017; Diao LP et al., 2017; Zhong FJ et al., 2017; Liu QN et al., 2018; Di QY et al., 2019; Zhang WH et al., 2019). An important way of successful ore prospecting is to establish integrated geological-geophysical-geochemical models in order to fully make use of geophysical and geochemical methods (Fang X et al., 2014; Li YJ et al., 2014; Su XL et al., 2014; Deng YP et al., 2016 ; Lei SB et al., 2016; Lin FL et al., 2016; Zhang S et al., 2017; Cao YL et al., 2018; Cheng XG et al., 2018; Song HW et al., 2018; Sun L et al., 2018; Tang JT et al., 2018; Wang YS et al., 2018; Zhang XD et al., 2018; Liu L et al., 2019; Liu ZQ et al., 2019; Fu ZY et al., 2019).

    The Lake Victoria greenstone belt is located in the northwest of Tanzania, and consists of 8 sub-greenstone terranes. It possesses excellent ore-forming geological conditions and is an important gold mineralization belt in East Africa. Among the 8 greenstone belts, the Archaic Musoma-Mara greenstone belt in the east of Lake Victoria is an important gold concentration area, and contains large and middle-sized gold deposits including the North Mara, Buhemba and Ikungu deposits. The Musoma-Mara greenstone belt has well-developed fault structures with strong magmatic activity and good metallogenic conditions and prospects, but it has been poorly understood in terms of geology and exploration (Messo CW et al., 2012; Mshiu EE and Maboko MAH, 2012; Ren JP et al., 2013; Wang JG et al., 2017; Wan YS et al., 2018; Zhang Q et al., 2018).

    The Nyasirori gold deposit is located in the middle-western part of the Musoma-Mara greenstone belt with 11 t of (332) + (333) gold resources. It is the second largest medium sized gold deposit discovered by No. 2 Institute of Geological and Mineral Resources Survey of Henan, after the Mwamola super-large gold deposit containing 34 t of (332) + (333) class gold resources. The Mwamola gold deposit is a concealed banded iron formations (BIF) type one (Li SP et al., 2014, 2018, 2019), and the Nyasirori gold deposit is a concealed tectonic altered rock type gold deposit, both of which are the main gold deposit types in the Tanzanian Archean greenstone belt. Li SP et al. (2016) established a comprehensive geological-geophysical-geochemical prospecting model of the Mwamola BIF gold deposit, which has played a guiding role in the gold ore exploration in Tanzania in recent years. For example, the BIF type gold deposit PL10957 has been proved to contain nearly 8 t of (332) + (333) type gold resources. In comparison, tectonic altered rock type gold deposits have different physical properties of ore-bearing bodies and ore-forming environments, and the comprehensive prospecting models are different. Therefore, this work established an integrated prospecting model for the Nyasirori tectonic altered rock type gold deposit, and determined a preferred combination of geophysical and geochemical methods for prospecting targets, which is important for discovering this type of gold deposits in the Musoma-Mara greenstone belt and other greenstone belts in Tanzania.

    Tanzania is located in the northern part of the Tanzanian shield. This shield is an elliptical Archean craton block, which was subjected to complex splicing and orogeny in the Archean; it has been relatively stable since the Neoarchean, and the Proterozoic activity belt is mostly banded surround craton (Fig. 1; Manya S et al., 2006; Kabete JM et al., 2012a, 2012b; Thomas RJ et al., 2016; Sommer H et al., 2017; Van Ryt MR et al., 2017; Boniface N and Appel P, 2018; Sun K et al., 2018; Astort A et al., 2019; Piette-Lauzière N et al., 2019; Sinha ST et al., 2019). Tanzania is roughly divided into 3 major geotectonic units, i.e., the granite-greenstone belt of the Archean Tanzanian Craton in the north-central part, the Archean Ubindi orogenic belt and the Usagaran orogenic belt on both sides of the craton, and the Cenozoic East African Rift Valley (Guo HJ et al., 2009). The Archean Musoma-Mara greenstone belt is located in the north of the Tanzania Craton, east of Lake Victoria, and the Nyasirori gold deposit is located in the middle and western ends of this greenstone belt.

    Figure 1.  Simplified geological map showing tectonic position of Tanzania (after Tan DW et al., 2013).
    1−Neogene volcanic rocks; 2−Karroo and Neogene sediments; 3−Bukoban supergroup; 4−middle Proterozoic; 5−Paleoproterozoic; 6−Archean.

    Magnetic field measurements at a scale of 1:125000 indicate that magnetic anomalies around the Lake Victoria in Tanzania are mainly positive cloud-like anomalies, linear positive anomalies, linear negative anomalies, arc-shaped positive and negative associated anomalies and regular clusters, with local associated strong positive and negative anomalies and local weak anomalies. The southwestern part of Lake Victoria displays long and narrow linear anomalies from NE to SE with associated positive and negative anomalies. It has an interphase distribution and generally has an arc-shaped southward projection, reflecting that the region is subjected to a northwestward compression to generate dense folds. The anomalies coincide with the distribution of the Nyanzian group and BIF. The NS-trending linear positive magnetic anomaly belt in the south of Lake Victoria is associated with deep and large faults, and the regular positive and negative combination of strong magnetic anomalies in the eastern and southern parts of Lake Victoria is generally caused by basic rock mass (dyke) and iron formations. The cloud-like surface positive anomalies are distributed throughout the region with different intensities in different regions. These anomalies are mainly caused by magnetic minerals in the Archean granite and granitic gneiss. The Nyasirori gold deposit is located in a weak negative magnetic anomaly belt.

    As shown in Fig. 2b, regional aeromagnetic survey at a scale of 1:50000 indicates that this deposit exhibits cloud-like positive anomaly and linear positive and negative magnetic anomaly. The cloud-like surface anomaly is a reflection of the Archean granite body. Linear positive and negative magnetic anomalies caused by BIF and diabase extend largely in the NW, NS and EW directions. The Nyasirori deposit is located in the gentle magnetic field between the linearly NW-SE-trending magnetic anomalies.

    Figure 2.  Gelogical map (a) and geophysical field (b) of the Nyasirori gold deposit (modified from the Geological Survey Department of Dodoma, Tanzania, 1983).
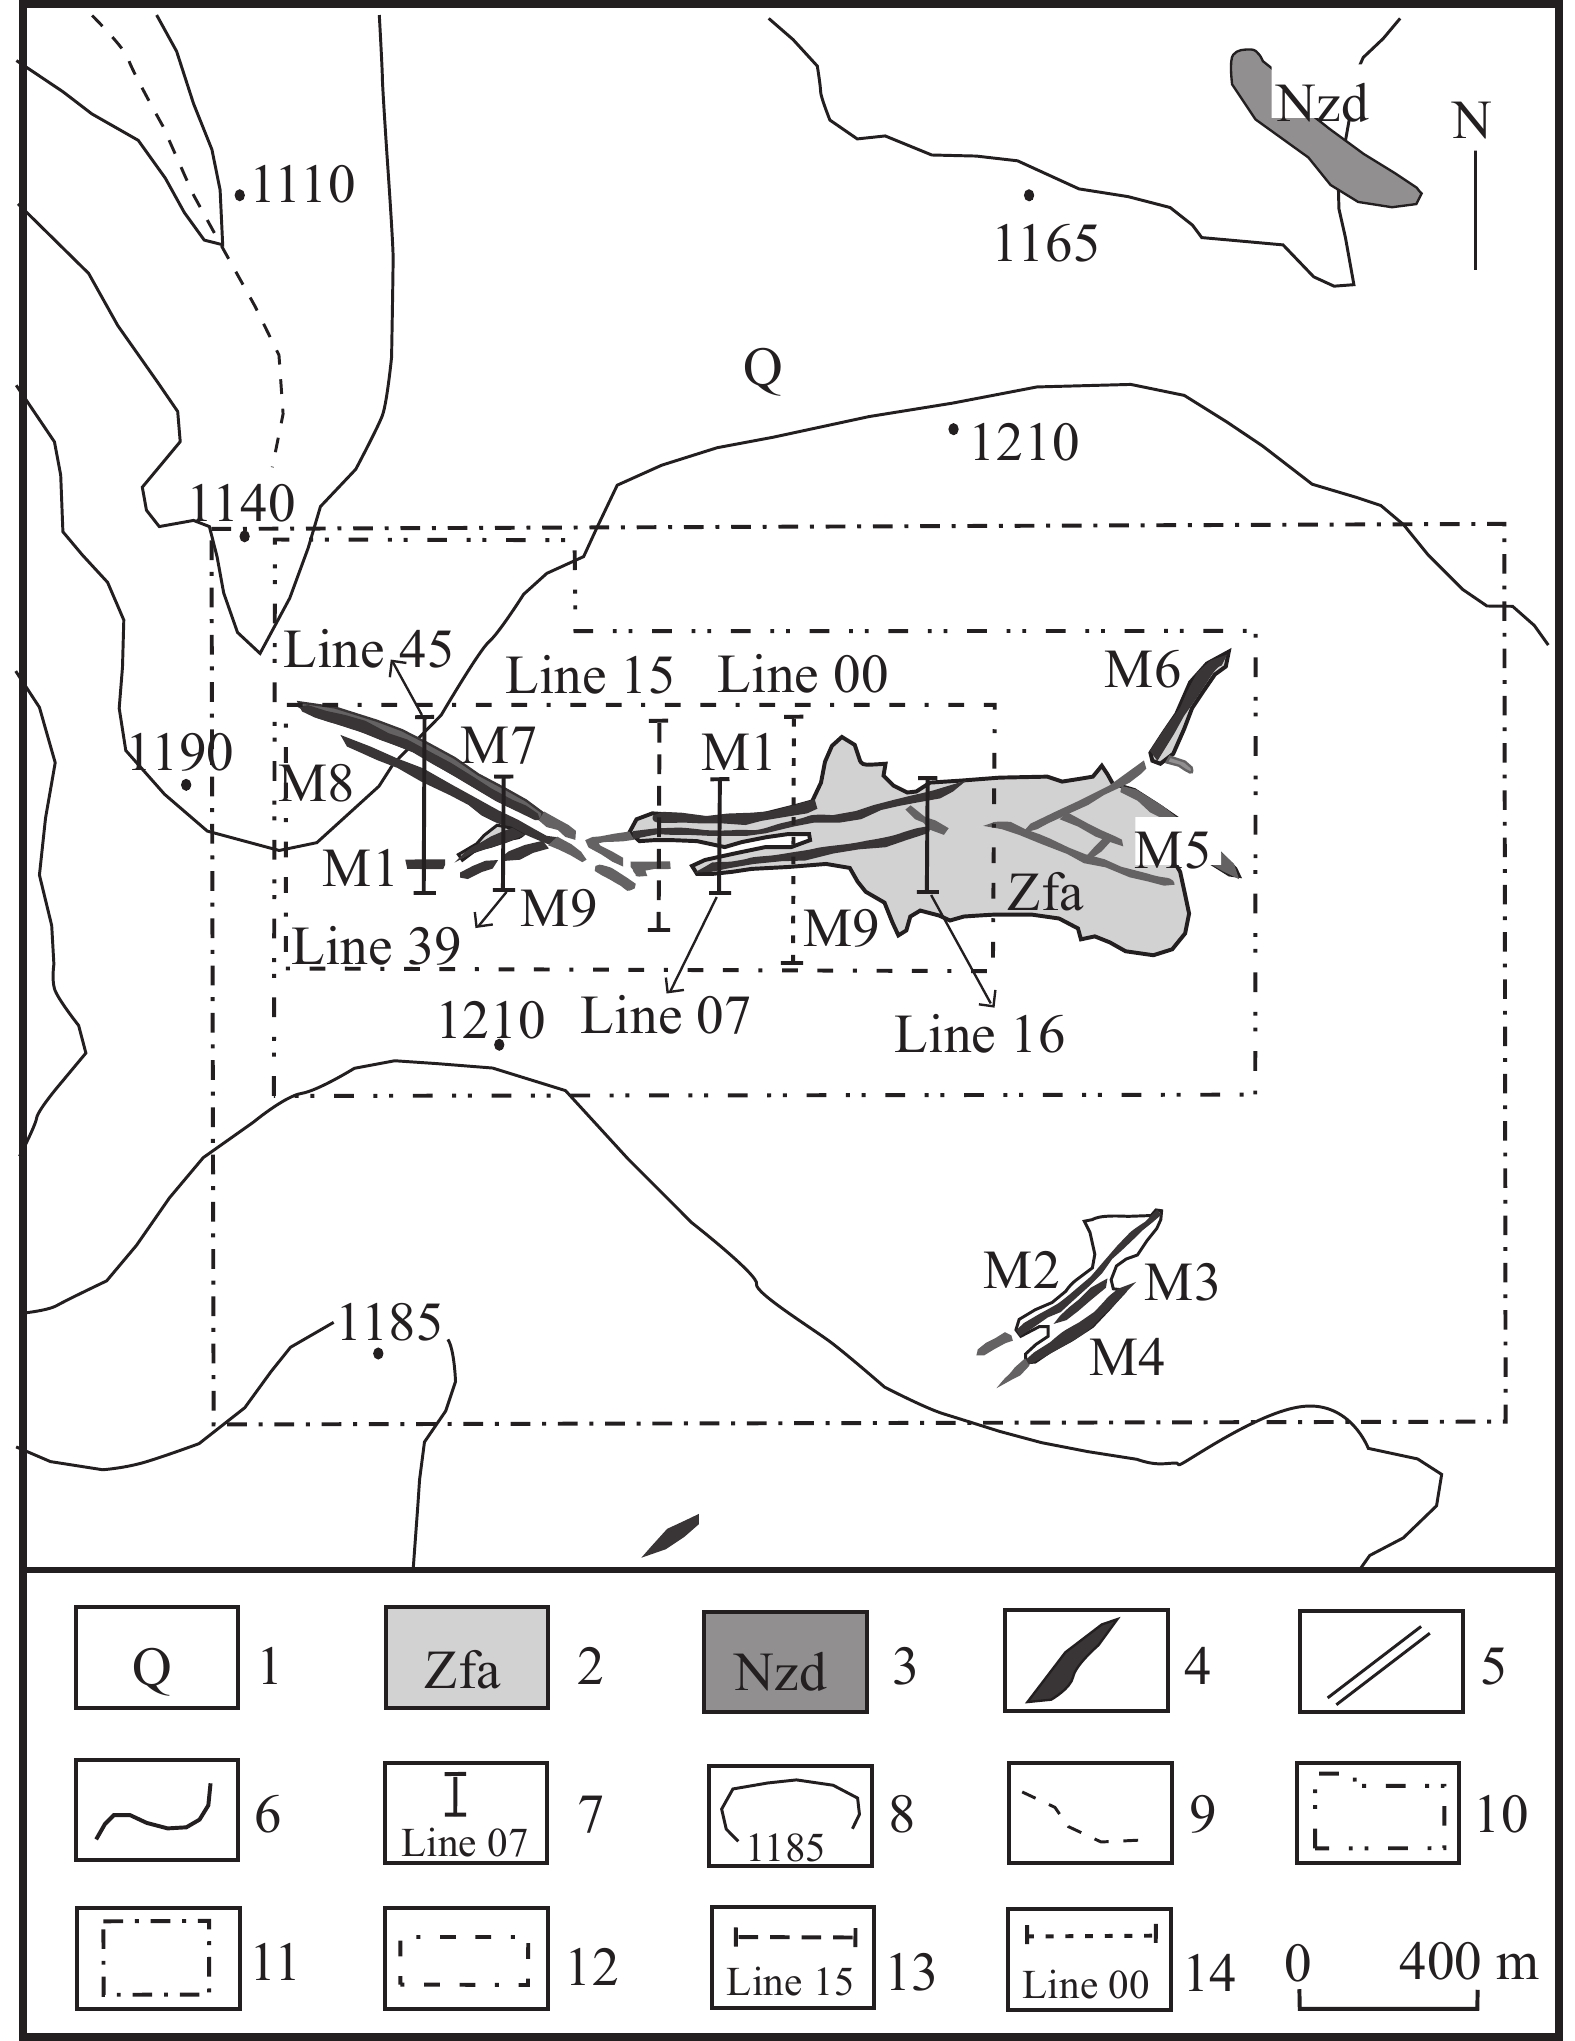
    1–Quaternary; 2–Archean Nyanzian BIF; 3–Archean granitoids; 4–Archean greenstone belts; 5–Proterozoic mafic intrusive rock; 6–shear zones/faults; 7–fracture; 8–terrane boundaries; 9–gold deposit; 10–region location.

    The regional strata are mainly the Archean Nyanzian group, consisting of a set of metamorphic basic volcanic rocks with green schist facies, metamorphic mafic volcanic-sedimentary rocks and local BIF.

    This deposit is largely covered by the Quaternary eluvial deluvium, and only metamorphic mafic tuff is sporadically exposed.

    This area mainly develops 3 groups of nearly parallel shear zones, i.e., nearly EW-trending (about 60°), NE-trending and NW-trending (about 310°, Fig. 2a). The early EW-trending shear zone was intersected by the late NE-trending and NW-trending ones. Correspondingly, strong deformation tectonic activities including secondary shear zones, fault zones, and folds are well developed, which provide favorable ore-forming conditions for the formation of gold deposits.

    The regional magmatic activity is intense, mainly consisting of syn-orogenic biotite granite, and post-orogenic monzonitic granite, alkaline granite, gabbro and diabase. The granite intruded along the north and south sides of the greenstone belt, partially split greenstone belt into island arc shape. The gabbro is associated with the biotite granitoid and should be formed by the intrusion of mantle sources during syn-orogenic volcanic activity. The diabase is mainly intrusive along the fault zone and is consistent with the trend of the large fault tectonic belt; it is linear and beaded, mostly formed by the intrusion of post-orogenic mantle sources (Si JT et al., 2017). Multi-stage magmatic intrusion provides sufficient fluid and thermodynamic conditions for the activation and enrichment of ore-forming elements.

    The deposit is largely covered by the Quaternary residual slope sediments (Fig. 3). Sporadically exposed bedrock is mainly low green schist facies metamorphic mafic tuff. No magmatic rocks were exposed in the mining area. Fault structures are developed, mainly consisting of nearly EW-trending, NW-trending and NE-trending ductile-brittle shear tectonic belts. Gold ore bodies are mainly hosted in the ductile-brittle shear structural alteration zone, whose occurrence is strictly controlled by the tectonic alteration zone. The main fault zones have the following characteristics.

    Figure 3.  Geological sketch map of the Nyasirori gold deposit.
    1–Quaternary; 2–metatuffs; 3–diabase; 4–gold orebody; 5–gold mineralized alteration belt; 6–geological boundary; 7–prospecting line; 8–contour; 9–stream; 10–IP intermediate gradient survey area; 11–area of soil geochemical prospecting; 12–area of micromagnetic measurement; 13–profile of IP sounding; 14–profile of audio magnetotelluric sounding.

    (i) EW-trending fault zone. It is located in the middle of the deposit, with an intermittent exposure length of about 1.3 km, and consists of a series of nearly parallel compression-torsion fractures and compression fractured zones extending from 75° to 90°. The eastern and central western parts of the fault zone were intersected by 2 groups of NW-trending faults with a fault distance of 10–25 m. Due to the compression shearing effect, the fault plane displays obvious wavy bending, and the fracture trends SSE, with an inclination of 60°–85° and a width of 2–20 m. This fault zone develops foliated cataclastic altered rocks and breccias, and displays certain ductile shear characteristics. The rock and minerals have a directional elongated arrangement, and the quartz veins ranging from 2 cm to 10 cm in width mainly distribute along the fault zone and altered rocks. Silicification, beresitization, chloritization, and carbonation are relatively developed. Metal mineralization includes limonitization, pyritization, arsenopyritization, accompanied by gold mineralization. The fault zone has undergone multi-period activities with strong alteration, which is conducive to the formation and enrichment of gold orebodies. The gold mineralized alteration zones such as M1 and M9 occur in this fault zone.

    (ii) NW-trending fault zones. Several groups of NW-trending fault zones are developed in the deposit. Two NW-trending fault zones in the central of the deposit cut NEE-trending fault zone, which is of a right-lateral strike-slip nature. These 2 fault zones strike 125° with opposite inclinations; the east fault zone strikes NW with a dip angle of 50°–85°, and the west one strikes SW with a dip angle of 40°–60°. This fault zone is 1–5 m in width, and develops tectonic breccia and cataclasite. The center of the fault zone is filled with grayish quartz vein, which ranges from 20 cm to 50 cm in width and displays a cryptocrystalline texture. Localized strong alteration is dominated by silicification, sericitization, and carbonation. Metal mineralization is mainly limonitization, pyritization and pyrrhotitization, with relatively weak gold mineralization. Gold mineralized alteration zones such as M5, M7 and M8 occur in these fault zones.

    (iii) NE-trending fault zone. It is located in the south-central part of the deposit, with an intermittent exposure length of about 500 m, and consists of a series of nearly parallel NE-trending compression-torsion fault zones. It strikes SE with a dip angle of about 65°–85°, and is 1–5 m in width. Foliated cataclastic altered rock and breccia are developed, which exhibit certain ductile shear characteristics. The rocks and minerals have a directional elongated arrangement, and quartz vein ranging from 2 cm to 10 cm in width mainly distributed along the fault zone and altered rocks. Silicification, beresitization, chloritization and carbonation are dominated. Metal mineralization is mainly limonitization, pyritization and arsenopyritization, accompanied by gold mineralization. The known gold mineralized alteration zones such as M2, M3, M4 and M6 are present in this fracture zone.

    Nine gold mineralized alteration belts have been discovered in the Nyasirori deposit (Fig. 3). They mainly strike EW, with few striking NW and NE, mostly appearing in groups (Fig. 4). The occurrence is basically consistent with that of the surrounding rock formation. The EW-trending gold mineralized alteration belt was affected by the NW-trending sinistral strike-slip structures and superimposed mineralization, which has the best ore-bearing property. The main ore body M1-I in the M1 alteration belt displays irregular veins, with local expansion and contraction, branching compounding and pinch-out. It strikes EW and trends south, with a dip angle of 65°–80°. The burial depth of the top orebody is 2–5 m, extending 850 m along the strike and 350 m along the inclination. The average thickness of the ore body is 2.38 m and the average gold grade is 6.26×10⁻⁶. The orebody in the NW-trending and NE-trending alteration belts are thin and poor, with an average thickness of 1.35 m and an average gold grade of 2.87×10⁻⁶.

    Figure 4.  Geological section along the prospecting line No. 07 in the Nyasirori gold deposit.
    1–Quaternary; 2–metatuff; 3–silicolite; 4–cataclasite; 5–gold orebody; 6–drillhole; 7–fault zone.

    The ore types are simple, which are dominated by densely disseminated pyrite sericite altered rock type and gold-bearing quartz vein ones (Figs. 5a, 5b). The ore textures mainly include euhedral to subhedral granular and cataclastic, and the ore structures are dominated by massive, fine veined and disseminated structures (Fig. 5c).

    Figure 5.  Photos showing the alteration and ore types of the Nyasirori gold deposit.
    a–Pyritized cataclastic altered rock; b–gold-bearing quartz veins; c–veined pyrite and arsenopyrite; d–granular natural gold; e–gold distributed in pyrite; f–gold distributed in quartz.

    Metal minerals in the ores are mainly pyrite (about 5%), arsenopyrite (about 2%) and a small amount of pyrrhotite, chalcopyrite, magnetite, natural gold. Gangue minerals mainly include dolomite (about 25%), quartz (about 20%), chlorite (about 15%), and plagioclase (about 15%). Gold in the ores mainly occurs in the form of natural gold (Figs. 5df), which is present in the form of inclusion gold and intergranular gold (about 50% each). The shape is mainly angular granular and long-grained, followed by round granular, and the diameter is mostly between 0.010 mm and 0.037 mm.

    Table 1 shows the sequence of mineral formation.

    Table 1.  Sequence of main mineral formation in the Nyasirori gold deposit.
    MineralsMetallogenic stageSupergene period
    Pre-mineralization period
    Silicification and sericitization stage
    Metallogenic period
    Quartz + sericite + pyrite stage

    Arsenopyrite + pyrite stage

    Quartz + pyrite stage
    Post-mineralization period Low temperature quartz- carbonate stage
    Chlorite━━━━━━━━━━━━━━━━━━━━━━━━
    Sericite━━━━━━━━━━━━━━━━━━━━━━━━━━━━━━━━━━
    Potassium feldspar━━━━━━━━━━━━━━━
    Natural gold━━━━━━━━━━━━━━━━━━━━━━━━━━━━━━━━
    Pyrite━━━━━━━━━━━━━━━━━━━━━━━━━━━━━━━━━━━━━
    Arsenopyrite━━━━━━━━━━━━━━
    Chalcopyrite━━━━━━━━━━━━━━
    Quartz━━━━━━━━━━━━━━━━━━━━━━━━━━━━━━━━━━━━━━━━━
    Dolomite━━━━━━━━━━━━
    Calcite━━━━━━━━━━━━
    Montmorillonite━━━━
    Illite━━━━
    Hematite━━━━
    Limonite━━━━
     | Show Table
    DownLoad: CSV

    (i) Pre-mineralization period (silicification and sericitization stage)

    Early quartz is white, milky white, cryptocrystalline structure or fine granular structure, which is distributed in irregular masses. Quartz cementation occurred in tectonic belt to form siliceous breccia. Plagioclase was replaced by scaly aggregate sericite, and the sericite is arranged in weak orientation to form a schistosity structure.

    (ii) Metallogenic period

    It can be divided into 3 mineralization stages: (1) Quartz+sericite+pyrite stage, which is the main metallogenic stage with the precipitation of natural gold accompanied by pyrite and quartz; (2) Arsenopyrite+pyrite stage is a main ore-forming stage, and the gold ores rich in arsenopyrite have high grade; (3) Quartz+pyrite stage is another main metallogenic stage, when scattered and fine veined pyrite is closely associated with quartz veins.

    (iii) Post-mineralization period (low temperature quartz-carbonate stage)

    Low-temperature quartz and carbonate minerals were formed in this stage, mainly represented by greyish and grey-yellow quartz-calcite veins developed along fissures, and occasionally associated with fine-grained pyrites.

    (iv) Supergene period

    Influenced by epigenetic action, silica-alumina minerals were weathered to kaolinite and halloysite, and metal sulfides such as pyrite were oxidized to honeycomb limonite. As a result, oxidation leaching led to poor gold grade.

    Hydrothermal alteration mainly includes silicification, pyritization, arsenopyritization, limonitization, sericitization, carbonation, etc., of which silicification, pyritization, arsenopyritization are most associated with gold mineralization. The gold enrichment is positively correlated with the content of pyrite and arsenopyrite. The hydrothermal alteration is controlled by structural fractured zone, and exhibits certain zonation, which occurred from the center of the fault zone to the both sides, with weakened alteration intensity. According to the mineralization, alteration intensity and altered mineral assemblages, the alteration zone can be divided into inner alteration zone and outer alteration zone.

    It is distributed near the main fault plane of the fault zone, and its boundary is basically consistent with the top and bottom floor of the fracture zone. The alteration is intense and complex, which is dominated by pyritic sericitization, silicification and arsenopyritization, followed by carbonation and chloritization. The gold ore body is just distributed in the inner alteration zone.

    It is distributed in a certain range outside the broken roof of the fault zone. The main alteration types are silicification, carbonation, epidotization and chloritization. The alteration becomes weak from the top and bottom floor to the outside, and the width is generally 5 m to 10 m.

    (i) Magnetism. The diabase in the area is highly magnetic, and greatly differs from the structurally altered rock and metamorphic tuff (Table 2). The gold occurs in the strongly altered rocks in ductile shear zone, and magnetic differences can thus be utilized to discriminated ore-bearing structurally altered rock with the surrounding rock (Li SP et al., 2017).

    Table 2.  Statistics of magentic parameters of rocks and ores in the Nyasirori gold deposit.
    Rocks (ores)Number of samplesMagnetic susceptibility /(κ×10−5 SI)Sampling location
    Structural altered rocks (gold ores, mineralized rocks, tectonite, altered rocks)9715Drill hole
    Surrounding rock (metamorphic tuff)15250Drill hole
    Siliceous rock3230Drill hole
    Diabase301980Surface
    Breccia (gossan)1485Surface
     | Show Table
    DownLoad: CSV

    (ii) Electrical properties. Compared with ore-hosted surrounding meramorphic tuff, the detection target (structural altered rock) has a relatively low resistivity and a relatively high polarizability (Table 3). Thus, electrical and induced polarization characteristics can be used to distinguish targeted body with the surrounding rock.

    Table 3.  Statistics of electrical property parameters of rocks and ores in the drill hole of Nyasirori gold deposit.
    RocksSample numberResistivity ρ/(Ω·m)Polarizability η/%
    Diabase13296330.61
    Breccia (gossan)1187600.81
    Siliceous rock1756230.5
    Metamorphic tuff4732720.54
    Structural altered rocks (ores, mineralized rocks, tectonite, altered rocks)325064.78
     | Show Table
    DownLoad: CSV

    The physical characteristics of the rocks and ores in the Nyasirori gold deposit are summarized in Table 4.

    Table 4.  Physical properties of rocks and ores in the Nyasirori gold deposit.
    Geological body and main lithologyMagneticResistivityPolarizability
    DiabaseMediumExtremely highMicro
    Breccia (gossan)WeakHighMicro
    Siliceous rockMicroHighMicro
    Surrounding rock: metamorphic tuffMicroHighMicro
    Ore-bearing zone: structural altered zoneMicroMediumWeak
     | Show Table
    DownLoad: CSV

    The high-precision ground magnetic survey at a scale of 1:10000 indicates that the magnetic anomaly △T displays a NW-trending linear distribution (Fig. 6). The Nyasirori gold deposit is located in the steady magnetic anomaly zone between the south and north linear magnetic anomaly zones, and the weak magnetic anomaly zone with local associated positive and negative anomalies, with △T value of –50nT to 50 nT. Due to the strong magnetism of diabase differing from greenstone zone, magnetic anomalies can well reflect the characteristics of regional geological structures (Cheng H et al., 2015). The linear zonal anomalies in the exploration area are related to diabase and fault structures, and the low-weak magnetic field area is related to the non-magnetic to micro-magnetic greenstone strata. According to the characteristics of magnetic anomalies, 5 large-scale faults (F1–F5) were identified, and the low-weak magnetic field area confined by 5 faults was delineated as gold prospecting targets.

    Figure 6.  Surface magnetic anomalies △T of the Nyasirori gold mine.
    1–Magnetic contour; 2–magnetic anomaly zone; 3–main gold vein area; 4–target area; 5–expose gold occurrence; 6–fault number.

    (i) The IP intermediate gradient anomaly and the reflect to gold mineralized alteration zone

    The contours delineated by the apparent polarization rate (ηS) 1.5% (Fig. 7a) and apparent resistivity (ρS) 400 Ω·m (Fig. 7b) are roughly consistent with the soil geochemical anomaly Au-I, and are also basically the same as the extension of the known gold orebodies and gold alteration zone (Fig. 7c). The range of the IP anomaly can be reflected by multiple vein groups composed of gold alteration zones containing metallic sulfides.

    Figure 7.  IP anomalies of the Nyasirori gold mining area.
    a–Plan view of apparent polarizability of IP intermediate gradient; b–plan view of apparent resistivity of IP intermediate gradient survey; c–geological map. 1–Au-I soil anomaly; 2–Quaternary; 3–meta tuff; 4–gold ore bodies and numbers; 5–gold mineralized alteration zone; 6–geological boundary.

    (ii) Location of the tectonic alteration zone and the extension of gold orebodies by IP sounding section

    The structural alteration zone and gold orebodies are featured by medium resistance and weak polarization, which are located in the concave position of 2 medium resistivities in the apparent resistivity profile, and the polarizability parameters display weak polarization anomaly. The exploration results confirm that the anomalous position corresponds to the structural fractured alteration zones M9, M1-I and gold body in the borehole section (Fig. 8), which indicates that the IP sounding method is effective for positioning the fractured alteration zone and gold orebodies in the Nyasirori mining area.

    Figure 8.  Comprehensive geological-geophysical profiles along the line 15 in the Nyasirori gold deposit.
    a–Apparent resistivity pseudosection of IP sounding; b–profile of apparent polarizability in IP sounding; c–profile of micromagnetic anomaly △T; d–geological profile of drillhole. 1–tectonic alteration zone; 2–Quaternary residual slope sediments; 3–meta tuff; 4–gold orebody.

    (iii) Spatial distribution of ore-bearing fractured alteration zone indicated by relatively low resistivity anomaly in electromagnetic section

    The ρS contours in the middle of the apparent resistivity section of the audio magnetotelluric sounding show a steep and drastic decline (Fig. 9). The relatively low resistivity is relatively prominent, and the position corresponds to the fractured alteration zone and gold body of M9 and M1-I, which indicates that the fractured alteration zone and gold body have relatively low resistivity anomalies. In the exploration, the distribution of the low concave resistivity zone is used to understand the fractured alteration zone and the occurrence of gold orebodies, which provides basis for the anomaly detection and the layout of drilling engineering.

    Figure 9.  Comprehensive geological-geophysical profiles along line 00 in the Nyasirori gold mining area.
    a–Profile of apparent resistivity in audio magnetotelluric sounding; b–profile of micromagnetic anomaly △T; c–geological profile of drillhole. 1–Tectonic alteration zone; 2–Quaternary residual slope sediments; 3–meta tuff; 4–gold orebody.

    (iv) Discrimination of concealed gold bodies by micromagnetic anomalies

    Micromagnetic measurements were conducted to determine the fine magnetic field structure caused by the tectonic alteration zone and gold orebodies (Fig. 10). The gold vein and tectonic alteration zone were near the zero line, which lies between the micromagnetic positive and negative △T contours. The micromagnetic anomaly △T displays an EW-trending and NW-trending distribution, and varies little, which corresponds well with the structural alteration zone and gold veins. It is indicated that micromagnetic anomalies can clearly reflect the fine magnetic field characteristics caused by the tectonic alteration zone and gold vein group (Li SP et al., 2017).

    Figure 10.  Plan of micromagnetic anomaly △T in the Nyasirori gold mining area.
    1–Positive contour; 2–negative contour; 3–zero contour; 4–gold mineralized alteration belt and serial number; 5–gold vein and number; 6–inferred fault and number.

    On the NS-trending micromagnetic anomaly profile, the positive points of anomalies correspond to the tectonic alteration zone and the head of the gold vein (surface shallow part), while the negative points correspond to the deep extension of the tectonic alteration zone and gold vein (Fig. 8c, Fig. 9b). Micromagnetic anomaly is a shallow surface marker for determining concealed mineralization.

    Soil geochemical analysis of the 10 elements including Au, Ag, Cu, Pb, Zn, W, Mo, As, Sb and Bi shows that the variation coefficients of Au, As, and Bi are all larger than 0.25, indicative of a high abnormal intensity (Table 5). It is indicated that they are spatially unevenly distributed and that the elements are locally enriched or depleted, especially the highly enriched element As. Other elements are basically evenly distributed, and display local weak enrichment or depletion of elements.

    Table 5.  Statistics of soil geochemical data for the Nyasirori gold deposit.
    ParametersAuAgCuPbZnWMoAsSbBi
    Clark value4.000.07055.0012.5070.001.501.501.800.200.17
    Mean value6.920.07741.3915.0953.332.761.3113.060.250.15
    Maximal value1300.000.9001130.00111.00713.0014.203.765739.004.363.54
    Minimum value0.460.05116.205.3020.502.450.781.150.090.07
    Standard deviation3.170.0099.523.3810.940.120.215.670.090.04
    Coefficient of variation0.460.1200.230.220.210.040.160.430.340.24
    Concentration coefficient1.731.1000.751.210.761.840.877.261.250.88
    Background value7.000.08041.0015.0053.502.761.3013.000.250.15
    Anomaly threshold16.000.10065.0024.0078.003.001.8030.000.500.20
    Note: The elements were tested in the Zhengzhou Mineral Resources Supervision and Testing Center, Ministry of Natural Resources. Au, 10–9, others, 10–6.
     | Show Table
    DownLoad: CSV

    Correlation analysis (Table 6) and R-type cluster analysis (Fig. 11) of the soil geochemical measurements suggest that the ore-forming element Au has significant correlation with As and Sb. They are a group of sulphophile elements, and are generally related to fault activity, indicating that As and Sb have a good indication of gold mineralization.

    Table 6.  Correlation of soil geochemical elements in the Nyasirori gold deposit.
    ElementsCuPbZnMoAgWAsSbBiAu
    Cu1
    Pb0.341
    Zn0.610.251
    Mo0.230.600.111
    Ag0.230.400.180.711
    W–0.19–0.02–0.200.010.031
    As0.300.260.360.280.19–0.071
    Sb0.460.540.490.510.33–0.090.731
    Bi–0.110.07–0.150.06–0.030.08–0.12–0.101
    Au0.170.070.280.150.11–0.050.710.48–0.041
     | Show Table
    DownLoad: CSV
    Figure 11.  R type cluster analysis of elements in the Nyasirori gold deposit.

    The element anomalies display an irregularly zonal distribution, and are mainly distributed in the middle of the deposit (Fig. 12). Anomaly elements are mainly Au, As, Sb, Cu and Zn. Among them, Au, As and Sb anomalies are large and strong, and have a significant concentration center. The inner, middle and outer zoning are clear and well-fitted, and the area is about 0.85 km2. Several abnormal high values of single element Au, As, Sb consecutively appear in the anomaly zone. Among them, the maximum anomaly value of Au is 1300×10–9, averaging 42.63×10⁻⁹; the maximum anomaly value of As is 5739×10–6, averaging 46.75×10⁻⁶; the maximum anomaly value of Sb is 4.36×10⁻⁶, averaging 0.56×10⁻⁶. Other elements have relatively weak anomalies, which are distributed in the middle and outer zones or only the outer zone.

    Figure 12.  Diagrams showing soil geochemical anomalies in the Nyasirori gold deposit.

    The anomalous area outcrops the Archean Nyanzian metamorphic tuff, and develops nearly EW-trending and NW-trending fault structures. The Au anomaly has a spatially larger distribution than the corresponding tectonic alteration zone. The tectonic alteration zone has the same trend as the anomalous concentration direction and is intermittently exposed in the middle and inner zones of the anomaly, which well fits with indicator elements As and Sb and is favorable gold prospecting area.

    According to the multi-source geological, geophysical and geochemical anomalies of the Nyasirori gold deposit, this work established an integrated prospecting model (Table 7). The main prospecting indicators and information are as follows.

    Table 7.  Integrated geological-geophysical-geochemical prospecting model for the Nyasirori gold deposit.
    Exploration methodProspecting indicatorsMineralization indicator characteristics or information
    Regional settingGeological structure locationNorthwestern of Tanzanian Craton
    Middle and western ends of the Archean Musoma-Mara greenstone belt
    Regional geophysical fieldIn a weak negative magnetic anomaly zone
    GeologyGeological strata and lithologyNyanzian mafic volcanic-sedimentary rocks
    TectonicsMultiple groups and multiple directions (near east-west, north-west and north-east), and the near-east-west shear tectonic belt is the main ore-bearing structure
    Magmatic rockPost-orogenic biotite granite
    Wallrock alterationSilicification, chlorite, carbonation and sericitization
    Characteristics of ore bodiesGold ore bodies are present in the shear structural alteration zone, which are irregular veins, with local expansion and contraction, branching and refraction, and other phenomena
    Ore mineralsNatural gold, pyrite, arsenopyrite, limonite and a small amount of pyrrhotite, chalcopyrite
    Direct prospecting signArtisan mining pit and surface or near-surface oxidation zone, grayish yellow or purple-yellow, honeycomb structure oxidized ore generally good in gold
    GeophysicsRegional geophysical fieldStrong negative magnetic anomaly is a northwestward linear band-like distribution associated with diabase
    Low-weak magnetic field is associated with non-magnetic-micromagnetic greenstone formations
    Detection targetTectonic fracture zone
    Target physical property characteristicsRock alteration magnetic weakening
    Medium and low resistivity, weak polarization
    Surface anomaly characteristicsηs anomalies and ρs anomalies are basically the same as those of the surface gold mineralization alteration belts
    The ∆T micromagnetic anomaly has the characteristics of weak and small magnetic field changes, and the gradient band between positive and negative has great correlation between the tectonic alteration zone and the gold vein
    GeochemistryGold orebody element distributionAu, As, Sb elements are unevenly distributed in space. There is a tendency of local enrichment or depletion. Au, Sb elements are characterized by enrichment and the As element is highly enriched
    Mineral-induced elemental anomaly combinationAu-Ag-Cu-Pb-Zn-As-Sb-W-Mo-Bi
    Abnormal shape of main elementsThe abnormal elements of soil measurement are mainly Au, As, Sb, Cu and Zn, and the anomalies are irregular and the long axis direction is near
    Distribution rangeEast-west, in which Au, As, Sb are large in scale, high in intensity, and concentrated in center, inner, top and outer bands
    Distinct features, well-fitted, close correlation of Au, As, Sb
     | Show Table
    DownLoad: CSV

    (i) The gold ore (mineralized) bodies are generally distributed in the tectonic fractured zone, and the orebody occurrence is strictly controlled by the tectonic fractured zone. Particularly, the nearly EW-trending tectonic fractured zone is superimposed by multi-stage mineralization, which is an important prospecting target.

    (ii) The wallrock alteration is mainly silicification, pyritization, arsenopyritization, limonitization, sericitization and carbonation. Among them, silicification, pyritization and arsenopyritization have the closest relationship with gold mineralization, and the gold enrichment is positively correlated with the content of pyrite and arsenopyrite.

    (i) Magnetic prospecting indicator. The structural altered zone and gold ore (mineralized) bodies are distributed in the weak magnetic anomaly area of the high-precision ground magnetic measurements. The micromagnetic measurement shows obvious combined positive and negative magnetic anomalies in the tectonic altered zone and gold ore (mineralized) body. The gold ore body is located on the positive and negative anomalous gradient belt of micromagnetic anomalies. The micromagnetic profile anomaly can indicate the spatial position of the concealed tectonic alteration zone and gold ore body.

    (ii) Electrical prospecting indicator. The tectonic alteration zone and gold ore (mineralized) bodies exhibit weak polarization and medium resistivity anomalies. The IP intermediate gradient method can roughly delineate the tectonic alteration zone and the gold ore (mineralization) body, and the IP sounding and magnetotelluric sounding can further determine the location.

    The Au, As and Sb anomalies delineated by soil geochemical measurements are important prospecting indicators. The ore-forming element Au has a significant correlation with As and Sb, which have a good indication for gold ore prospecting.

    (i) To discover and delineate gold mineralized zones or preferred prospecting targets. Most Tanzania’s land has been quasi-plainized, which is largely covered, with few exposed bedrocks. In the favorable metallogenic areas, the prospecting target area is preferred through 1:10000 high-precision ground magnetic scanning combined with the existing 1:125000 aeromagnetic survey or 1:50000 magnetic survey.

    (ii) To delineate mineralized enrichment sites. Combined with the IP intermediate gradient method or micro-magnetic measurement, soil geochemical measurements at a scale of 1:10000 were conducted to delineate mineralized enrichment sites.

    (iii) To determine the ore-hosted location and understand its occurrence. In combination with comprehensive geophysical profiles (IP intermediate gradient, micromagnetic measurement), IP sounding and audio magnetotelluric sounding were conducted.

    The integrated geological-geophysical-geochemical prospecting model has played a crucial role in the discovery of the Nyasirori gold deposit in Tanzania. High-precision ground magnetic survey provides anomaly information for preferring prospecting targets and inferring ore-forming relation and ore-forming environment. Based on this, soil geochemistry, IP intermediate gradient and micromagnetic measurement anomalies were conducted to delineate mineralized enrichment sites. IP sounding, audio magnetotelluric sounding and micro-magnetic measurement spatially were used to locate the tectonic alteration zone and gold ore body. Various methods are mutually verified, which has reduced the multiple solutions for anomalies.

    Based on the above results, drilling and trenching were carried out on the anomaly sections (Fig. 9). The results show that the delineated M1-I gold ore body along the line No. 00 has a gold grade of 2.09×10⁻⁶–8.38×10⁻⁶ and true thickness of 3.10–3.93 m. The gold orebodies M1-I, M1-II and M9-I were delineated along the prospecting line No. 07 (Fig. 4). Among them, the gold grade of M1-I gold ore body is 1.52×10⁻⁶–3.23×10⁻⁶ with true thickness of 0.97–3.32 m, that of M1-II gold ore body is 4.06×10⁻⁶–11.77×10⁻⁶ and true thickness is 2.36–7.51 m, and that of the gold grade of M9-I is 5.58×10⁻⁶ and the true thickness is 1.02 m. It is shown that the combination of physical with chemical methods as well as the workflow is reasonable and effective. Nine gold veins and 13 gold ore bodies have been discovered in Nyasirori which indicate 11 t of industrial (332) + (333) gold resources with average grade of 6.69×10⁻⁶ and average thickness of 2.45 m, achieving a sound prospecting effect. Currently, this gold deposit is in the development and construction stage.

    The previously known large and super-large gold deposits in Tanzania were discovered at the beginning of the 20th Century, which were discovered by surface ores as the initial prospecting cues with relatively simple prospecting methods. The Nyasirori gold mine has been the largest concealed tectonic altered rock type gold deposit discovered in Tanzania since the 21st Century. Affected by natural environments, Tanzania has few exposed bedrocks. The discovery of the Nyasirori gold deposit has opened up a way for discovering concealed gold deposits by integrated geological-geophysical-geochemical method. More and more similar gold deposits are expected to be discovered in Tanzania.

    (i) The newly discovered and proven Nyasirori medium-sized gold deposit is located in the central and western parts of the Musoma-Mara greenstone belt, belonging to a concealed tectonic altered rock type in greenstone belt. Such deposits are controlled by tectonic fractured zone, and are featured by medium-low resistance, weak magnetism and weak polarization, which are different from the previously explored and mined BIF type gold deposits in this area.

    (ii) An integrated multi-source prospecting model was established combined with the geological characteristics of the Nyasirori gold deposit. Tectonic altered rock type gold deposits are controlled by tectonic fractured zone, and the tectonic altered zones and gold ore (mineralized) bodies exhibit medium and low resistance, weak magnetism, weak polarization, and significant correlation of Au with As and Sb, which is the prospecting indexes of the same type of gold deposits in the area. This comprehensive prospecting index will be the key for the prospecting success in the area. In addition, for the first time, high density, high precision, and high resolution ground micromagnetic measurements have been applied to the exploration of structural altered rock type gold deposits. The fine magnetic field structures and abnormal distribution characteristics caused by the obtained micromagnetic bodies (tectonic alteration zones and gold veins) play an important role to determine the spatial distribution of hidden gold deposits.

    (iii) Effective geophysical and geochemical prospecting indicators (middle and low resistance, weak magnetism, weak polarization and Au-As-Sb-based elemental combination anomalies) and rational implementation plan of prospecting technologies (1:10000 high-precision ground magnetic surveying, 1:10000 soil geochemical measurement, combined with IP intermediate gradient array or micromagnetic measurement, IP sounding or audio magnetotelluric sounding) have laid foundation for the establishment of a comprehensive geological-geophysical-geochemical prospecting model. The establishment of this model will be an important reference and have a great impact on the research of concealed gold deposits in this region and other similar areas in the future.

    This work is financially supported by the Special Fund for Foreign Mineral Resources Risk Exploration (201210B01600234). The authors would like to express sincere gratitude to the reviewers who have provided significant suggestions for this manuscript.

  • [1] Astort A, Colavitto B, Sagripanti L, García H, Echaurren A, Soler S, Ruíz F, Folguera A. 2019. Crustal and Mantle Structure Beneath the Southern Payenia Volcanic Province Using Gravity and Magnetic Data. Tectonics, 38(1), 144–158. doi: 10.1029/2017TC004806

    CrossRef Google Scholar

    [2] Boniface N, Appel P. 2018. Neoproterozoic reworking of the Ubendian Belt crust: Implication for an orogenic cycle between the Tanzania Craton and Bangweulu Block during the assembly of Gondwana. Precambrian Research, 305, 358–385. doi: 10.1016/j.precamres.2017.12.011

    CrossRef Google Scholar

    [3] Cao YL, Cheng GJ, Zhao CL, Wang T, Jiang HY. 2018. Application of CSAMT in hydrogeology exploration in Shandong Province−An example from geothermal exploration in Changdao County (south four islands). Journal of Groundwater Science and Engineering, 6(1), 58–64. doi: 10.19637/j.cnki.2305–7068.2018.01.007

    CrossRef Google Scholar

    [4] Chen W, Zhou XP, He GW, Li W. 2017. The application of integrated geophysical and geochemical methods to the prospecting in the Tianjingwo tungsten polymetallic ore deposit. Geophysical and Geochemical Exploration, 41(4), 594–604 (in Chinese with English abstract).

    Google Scholar

    [5] Cheng XG, Chen X, Yan HP, Song NN, Ning Y. 2018. An integrated ore-prospecting method and model in search for Shuangshan alkali syenite Nb deposit in Fangcheng County, Henan Province. Geophysical and Geochemical Exploration, 42(2), 247–252 (in Chinese with English abstract).

    Google Scholar

    [6] Cheng H, Li SP, Yuan YS, Peng J, Si JT, Shao JB, Zhang AL, Jing P, Cao J. 2015. Identify magnetic anomaly characteristics of the banded iron formation and diabase in Tanzania and ore-prospecting. Progress in Geophysics, 30(6), 2623–2632 (in Chinese with English abstract).

    Google Scholar

    [7] Deng YP, Shi XQ, Wu JC. 2016. Applications of hydrogeophysics in characterization of subsurface architecture and contaminant plumes. Journal of Groundwater Science and Engineering, 4(4), 354–366.

    Google Scholar

    [8] Di QY, Zhu RX, Xue GQ, Yin CC, Li X. 2019. New development of the Electromagnetic (EM) methods for deep exploration. Chinese Journal of Geophysics, 62(6), 2128–2138 (in Chinese with English abstract). doi: 10.6038/cjg2019M0633

    CrossRef Google Scholar

    [9] Diao LP, Wang ZG, Wu BJ, Xie XY. 2017. Information analysis and optimization of ore targets in the Dushan antimony ore concentration area, Guizhou Province. Geology in China, 44(4), 793–809 (in Chinese with English abstract). doi: 10.12029/gc20170411

    CrossRef Google Scholar

    [10] Fang X, Tang JX, Li YB, Wang Q, Ding S, Zhang Z, Yang C, Li YB, Chen HQ, Wei LJ, Ni M. 2014. Metallogenic element spatial distribution of the Naruo copper (gold) deposit in the Duolong ore concentration area of Tibet and its geochemical exploration model. Geology in China, 41(3), 936–950 (in Chinese with English abstract).

    Google Scholar

    [11] Fu ZY, Xu XC, He J, Fan ZL, Xie QQ, Du JG, Chen F. 2019. Genetic Types and Metallogenic Model for the Polymetallic Copper-Gold Deposits in the Tongling Ore District, Anhui Province, Eastern China. Acta Geologica Sinica (English edition), 93(1), 88–110. doi: 10.1111/1755-6724.13635

    CrossRef Google Scholar

    [12] Guo HJ, Lin XH, Liu HR, Qin L, Fu FJ, Qin ZY. 2009. The Precambrian geological charateristics of Kigoma-Mpanda region, Tanzania and the new data of U-Pb age determination on zircon. Contributions to Geology and Mineral Resources Research, 24(3), 260–266 (in Chinese with English abstract).

    Google Scholar

    [13] Jiang SQ, Sun XG, Yang TZ, Li L, Yin XB, Wang C, Pan YB. 2014. Integrated anomaly model and metallogenci prediction of the Duolong porphyry copper-gold ore concentration area in northern Tibet. Geology in China, 361(2), 497–509 (in Chinese with English abstract).

    Google Scholar

    [14] Kabete JM, Groves DI, Mcnaughton NJ, Mruma AH. 2012a. A new tectonic and temporal framework for the tanzanian shield: implications for gold metallogeny and undiscovered endowment. Ore Geology Reviews, 48(5), 88–124.

    Google Scholar

    [15] Kabete JM, Mcnaughton NJ, Groves DI, Mruma AH. 2012b. Reconnaissance SHRIMP U-Pb zircon geochronology of the Tanzania Craton: Evidence for Neoarchean granitoid-greenstone belts in the Central Tanzania Region and the Southern East African Orogen. Precambrian Research, 216-219, 232–266. doi: 10.1016/j.precamres.2012.06.020

    CrossRef Google Scholar

    [16] Lei SB, Qing M, Niu CY, Wang L. 2016. Current Gold Prospecting in China. Acta Geologica Sinica (English edition), 90(4), 1298–1320. doi: 10.1111/1755-6724.12771

    CrossRef Google Scholar

    [17] Li SP, Wang JG, Bai DS, Yuan YS, Cheng H, Sun J, Feng P, Shao JB. 2014. Geophysical characteristics and prospecting indicators of the Maheiga gold deposit in Tanzania. Progress in Geophysics, 29(5), 2395–2400 (in Chinese with English abstract).

    Google Scholar

    [18] Li SP, Yuan YS, Si JT, Jing P, Sun J, Zhang L. 2016. An integrated ore prospecting model for the Mwamola gold deposit, Tanzania. Geology in China, 43(4), 1409–1419 (in Chinese with English abstract). doi: 10.12029/gc20160424

    CrossRef Google Scholar

    [19] Li SP, Peng J, Jing P, Zhang AL, Shao JB, Zhao HQ. 2017. Micromagnetic survey application research on a tectonic altered rock type gold deposit in Tanzania. Progress in Geophysics, 32(5), 2021–2028 (in Chinese with English abstract). doi: 10.6038/pg20170522

    CrossRef Google Scholar

    [20] Li SP, Yuan YS, Cheng H, Liu ZC, Liu ZH, Meng YJ, Xie YJ, Zhao HQ. 2018. Areomagnetic anomaly of the iron formation type gold deposit in Siga hills area, Tanzania and its prospecting significance. Progress in Geophysics, 33(3), 1051–1058 (in Chinese with English abstract). doi: 10.6038/pg2018BB0283

    CrossRef Google Scholar

    [21] Li SP, Si JT, Cheng H, Mao JB, Cao J, Sun J, Zhang Y, Gao FL. 2019. Application of time-domain IP sounding in the exploration of gold deposits in Tanzania. Progress in Geophysics, 34(2), 588–595 (in Chinese with English abstract). doi: 10.6038/pg2019CC0097

    CrossRef Google Scholar

    [22] Li YJ, Wei JH, Li H, Chen C, Shan L, Hou BJ. 2014. Geological, geophysical and geochemical characteristics and comprehensive prospecting model of the Xiasai Ag-Pb-Zn deposit in the Yindun Island Arc. Geology in China, 41(5), 1636–1649 (in Chinese with English abstract).

    Google Scholar

    [23] Lin FL, Wang GJ, Yang XY. 2016. Application of comprehensive electromagnetic study in deep mineralization mechanism-A case study of Wuxi polymetallic ore deposit, south Anhui. Chinese Journal of Geophysics, 59(11), 4323–4337 (in Chinese with English abstract). doi: 10.6038/cjg20161132

    CrossRef Google Scholar

    [24] Liu L, Liu ZQ, Huang M, Fei HC, Zhou J, Zhang YX, Hao ZG. 2019. China’s geological science and technology has made new progress during 2018. Acta Geologica Sinica (English edition), 93(3), 785–786. doi: 10.1111/1755-6724.14321

    CrossRef Google Scholar

    [25] Liu QN, Zhou XD, Su XY, He YL, Guo Z. 2018. An analysis of geological, geophysical and geochemical characteristics and prospecting potentiality of the Liulaowan area in Henan Province. Geology in China, 45(2), 392–407 (in Chinese with English abstract). doi: 10.12029/gc20180213

    CrossRef Google Scholar

    [26] Liu ZQ, Liu L, Huang M, Fei HC, Zhou J, Zhang YX, Hao ZG. 2019. Geological prospecting in China has achieved new breakthroughs during 2018. Acta Geologica Sinica (English edition), 93(3), 783–784. doi: 10.1111/1755-6724.14320

    CrossRef Google Scholar

    [27] Manya S, Kobayashi K, Maboko MAH, Nakamura E. 2006. Ion microprobe zircon U-Pb dating of the late Archaean metavolcanics and associated granites of the Musoma-Mara Greenstone Belt, Northeast Tanzania: Implications for the geological evolution of the Tanzania Craton. Journal of African Earth Sciences, 45(3), 355–366. doi: 10.1016/j.jafrearsci.2006.03.004

    CrossRef Google Scholar

    [28] Messo CW, Manya S, Maboko MAH. 2012. Geochemistry of the Neoarchaean Volcanic Rocks of the Kilimafedha Greenstone Belt, Northeastern Tanzania. Journal of Geological Research. doi: 10.1155/2012/603971.

    Google Scholar

    [29] Mshiu EE, Maboko MAH. 2012. Geochemistry and petrogenesis of the late Archaean high-K granites in the southern Musoma-Mara Greenstone Belt: Their influence in evolution of Archaean Tanzania Craton. Journal of African Earth Sciences, 66, 1–12. doi: 10.1016/j.jafrearsci.2012.03.002

    CrossRef Google Scholar

    [30] Pei RF, Mei YX, Qu HY, Wang HL. 2013. Geological tectonic settings, depositional environments and ore hosting rock assemblages for mineral deposits model with universality. Geology in China, 354(1), 31–41 (in Chinese with English abstract).

    Google Scholar

    [31] Piette-Lauzière N, Guilmette C, Bouvier A, Perrouty S, Pilote P, Gaillard N, Lypaczewski P, Linnen RL, Olivo GR. 2019. The timing of prograde metamorphism in the Pontiac Subprovince, Superior craton: Implications for Archean geodynamics and gold mineralization. Precambrian Research, 320, 111–136. doi: 10.1016/j.precamres.2018.10.016

    CrossRef Google Scholar

    [32] Ren JP, Wang J, Liu XY, He FQ, He SF. 2013. New Progress on the Golden Pride Gold Deposit Research of Nzega Greenstone Belt in Tanzania. Geological Survey and Research, 36(1), 47–53 (in Chinese with English abstract).

    Google Scholar

    [33] Si JT, Peng J, Liang YA, Qi D, Cao YJ, Mao JB. 2017. Relationships between structure and mineralization in Nyasirori gold deposit of Tanzania. Resources Environment and Engineering, 31(1), 23–26 (in Chinese with English abstract).

    Google Scholar

    [34] Sinha ST, Saha S, Longacre M, Basu S, Jha R, Mondal T. 2019. Crustal architecture and nature of continental breakup along a transform margin: New insights from Tanzania-Mozambique margin. Tectonics, 38(4), 1273–1291. doi: 10.1029/2018TC005221

    CrossRef Google Scholar

    [35] Sommer H, Kröner A, Lowry J. 2017. Neoproterozoic eclogite-to high-pressure granulite-facies metamorphism in the Mozambique belt of east-central Tanzania: A petrological, geochemical and geochronological approach. Lithos, 284−285, 666–690. doi: 10.1016/j.lithos.2017.05.010

    CrossRef Google Scholar

    [36] Song HW, Mu HD, Xia F. 2018. Analyzing the differences of brackish-water in the Badain Lake by geophysical exploration method. Journal of Groundwater Science and Engineering, 6(3), 187–192. doi: 10.19637/j.cnki.2305–7068.2018.03.004

    CrossRef Google Scholar

    [37] Su XL, Zhao YL, Zhao C, Zhang XM, Li HH, Liu GY, Song TT. 2014. Prospecting thinking and model for the Ketinghaer porphyry copper molybdenum deposit in the East Kunlun Mountains. Geology in China, 41(6), 2048–2062 (in Chinese with English abstract).

    Google Scholar

    [38] Sun K, Zhang LL, Zhao ZD, He FQ, He SF, Wu XY, Lei Q, Ren XD. 2018. Episodic crustal growth in the Tanzania Craton: evidence from Nd isotope compositions. China Geology, 1, 210–224. doi: 10.31035/cg2018025

    CrossRef Google Scholar

    [39] Sun L, Xu CP, Xiao KY, Zhu YS, Yan LY. 2018. Geological characteristics, metallogenic regularities and the exploration of graphite deposits in China. China Geology, 1, 425–434. doi: 10.31035/cg2018044

    CrossRef Google Scholar

    [40] Tan DW, Fu ZK, Guo L, Wang XY, Li L. 2013. Preliminary synthetic geological exploration study on PL7017 /2011 Shinyanga district, Tanzania. Journal of Guizhou University (Natural Sciences), 30(3), 52–55 (in Chinese with English abstract).

    Google Scholar

    [41] Tang JT, Li G, Zhou C, Ren ZY, Xiao X, Liu ZJ. 2018. Denoising AMT data based on dictionary learning. Chinese Journal of Geophysics, 61(9), 3835–3850 (in Chinese with English abstract). doi: 10.6038/cjg2018L0376

    CrossRef Google Scholar

    [42] Thomas RJ, Spencer C, Bushi AM, Baglow N, Boniface N, Kock G, Horstwood MSA, Hollick L, Jacobs J, Kajara S, Kamihanda G, Key RM, Maganga Z, Mbawala F, McCourt W, Momburi P, Moses F, Mruma A, Myambilwa Y, Roberts NMW, Saidi H, Nyanda P, Nyoka K, Millar I. 2016. Geochronology of the central Tanzania Craton and its southern and eastern orogenic margins. Precambrian Research, 277, 47–67. doi: 10.1016/j.precamres.2016.02.008

    CrossRef Google Scholar

    [43] Van Ryt MR, Sanislav IV, Dirks PHGM, Huizenga JM, Mturi MI, Kolling L. 2017. Alteration paragenesis and the timing of mineralised quartz veins at the world-class Geita Hill gold deposit, Geita Greenstone Belt, Tanzania. Ore Geology Reviews, 91, 765–779. doi: 10.1016/j.oregeorev.2017.08.023

    CrossRef Google Scholar

    [44] Wan YS, Liu SJ, Xie HQ, Dong CY, Li Y, Bai WQ, Liu DY. 2018. Formation and evolution of the Archean continental crust of China, A review. China Geology, 1, 109–136. doi: 10.31035/cg2018011

    CrossRef Google Scholar

    [45] Wang DB, Jiang SQ, Dong FL. 2016. Geological exploration of the Rongna porphyry copper deposit in the Duolong ore concentration area, northern Tibet. Geology in China, 43(5), 1599–1612 (in Chinese with English abstract). doi: 10.12029/gc20160510

    CrossRef Google Scholar

    [46] Wang JG, Peng J, Yuan YS, Si JT, Liang YA, Yang Y. 2017. Geological characteristics and metallogenic rules of gold deposits in the Mara-Musoma greenstone belt of Tanzania. Geology and Exploration, 53(2), 406–412 (in Chinese with English abstract).

    Google Scholar

    [47] Wang YS, Liu SF, Wang JH, Qin XY, Liu GQ, Cui XL. 2018. Geophysical field characteristics and deep ore prospecting prediction of the Nannihu molybdenum lead-zinc-silver polymetallic ore field in East Qinling Mountain. Geology in China, 45(4), 803–818 (in Chinese with English abstract). doi: 10.12029/gc20180411

    CrossRef Google Scholar

    [48] Yang J, Wang XB, Wang YH, Wang Q, Zeng QQ. 2014. The application of integrated geophysical methods of magnetic survey and AMT to the exploration of the Beiya gold deposit. Geology in China, 41(2), 602–610 (in Chinese with English abstract).

    Google Scholar

    [49] Zhong FJ, Pan JY, Xia F, Zhang Y, Liu GQ, Liu Y. 2017. A study of an integrated anomaly model and an exploration model for uranium exploration in Yuhuashan area, Jiangxi Province. Geology in China, 44(6), 1234–1250 (in Chinese with English abstract). doi: 10.12029/gc20170613

    CrossRef Google Scholar

    [50] Zhang Q, Liu Y, He M, Bai J, Xu W, Zhao C. 2018. Ore prospecting model and targets for the Dashuigou tellurium deposit, Sichuan Province, China. Acta Geochimica, 37(4), 578–591. doi: 10.1007/s11631-018-0271-x

    CrossRef Google Scholar

    [51] Zhang S, Xiao K, Zhu Y, Cui N. 2017. A prediction model for important mineral resources in China. Ore Geology Reviews, 91, 1094–1101. doi: 10.1016/j.oregeorev.2017.09.010

    CrossRef Google Scholar

    [52] Zhang WH, Wang DD, Li SZ, Zhou XG, Zhang JD, Liu WB, Zhou XM, Wang PY. 2019. The application of gravity-magnetic-electric prospecting engineering for Carboniferous-Permian petroleum geological survey in Sanjiang Basin. Heilongjiang Province. Geology in China, 46(1), 191–202 (in Chinese with English abstract). doi: 10.12029/gc20190112

    CrossRef Google Scholar

    [53] Zhang XD, Meng XH, Chen ZX, Wang J, Xiu CX. 2018. Comprehensive study of the geological and geophysical characteristics of the metallogenic belt in Southwest Fujian–A case study in the Yongding-Dapai polymetallic ore deposit. Chinese Journal of Geophysics, 61(4), 1588–1595 (in Chinese with English abstract). doi: 10.6038/cjg2018L0666

    CrossRef Google Scholar

  • 加载中
通讯作者: 陈斌, bchen63@163.com
  • 1. 

    沈阳化工大学材料科学与工程学院 沈阳 110142

  1. 本站搜索
  2. 百度学术搜索
  3. 万方数据库搜索
  4. CNKI搜索

Figures(12)

Tables(7)

Article Metrics

Article views(1634) PDF downloads(15) Cited by(0)

Access History

Catalog

    /

    DownLoad:  Full-Size Img  PowerPoint
    • Table 1.  Sequence of main mineral formation in the Nyasirori gold deposit.
      MineralsMetallogenic stageSupergene period
      Pre-mineralization period
      Silicification and sericitization stage
      Metallogenic period
      Quartz + sericite + pyrite stage

      Arsenopyrite + pyrite stage

      Quartz + pyrite stage
      Post-mineralization period Low temperature quartz- carbonate stage
      Chlorite━━━━━━━━━━━━━━━━━━━━━━━━
      Sericite━━━━━━━━━━━━━━━━━━━━━━━━━━━━━━━━━━
      Potassium feldspar━━━━━━━━━━━━━━━
      Natural gold━━━━━━━━━━━━━━━━━━━━━━━━━━━━━━━━
      Pyrite━━━━━━━━━━━━━━━━━━━━━━━━━━━━━━━━━━━━━
      Arsenopyrite━━━━━━━━━━━━━━
      Chalcopyrite━━━━━━━━━━━━━━
      Quartz━━━━━━━━━━━━━━━━━━━━━━━━━━━━━━━━━━━━━━━━━
      Dolomite━━━━━━━━━━━━
      Calcite━━━━━━━━━━━━
      Montmorillonite━━━━
      Illite━━━━
      Hematite━━━━
      Limonite━━━━
       | Show Table
      DownLoad: CSV
    • Table 2.  Statistics of magentic parameters of rocks and ores in the Nyasirori gold deposit.
      Rocks (ores)Number of samplesMagnetic susceptibility /(κ×10−5 SI)Sampling location
      Structural altered rocks (gold ores, mineralized rocks, tectonite, altered rocks)9715Drill hole
      Surrounding rock (metamorphic tuff)15250Drill hole
      Siliceous rock3230Drill hole
      Diabase301980Surface
      Breccia (gossan)1485Surface
       | Show Table
      DownLoad: CSV
    • Table 3.  Statistics of electrical property parameters of rocks and ores in the drill hole of Nyasirori gold deposit.
      RocksSample numberResistivity ρ/(Ω·m)Polarizability η/%
      Diabase13296330.61
      Breccia (gossan)1187600.81
      Siliceous rock1756230.5
      Metamorphic tuff4732720.54
      Structural altered rocks (ores, mineralized rocks, tectonite, altered rocks)325064.78
       | Show Table
      DownLoad: CSV
    • Table 4.  Physical properties of rocks and ores in the Nyasirori gold deposit.
      Geological body and main lithologyMagneticResistivityPolarizability
      DiabaseMediumExtremely highMicro
      Breccia (gossan)WeakHighMicro
      Siliceous rockMicroHighMicro
      Surrounding rock: metamorphic tuffMicroHighMicro
      Ore-bearing zone: structural altered zoneMicroMediumWeak
       | Show Table
      DownLoad: CSV
    • Table 5.  Statistics of soil geochemical data for the Nyasirori gold deposit.
      ParametersAuAgCuPbZnWMoAsSbBi
      Clark value4.000.07055.0012.5070.001.501.501.800.200.17
      Mean value6.920.07741.3915.0953.332.761.3113.060.250.15
      Maximal value1300.000.9001130.00111.00713.0014.203.765739.004.363.54
      Minimum value0.460.05116.205.3020.502.450.781.150.090.07
      Standard deviation3.170.0099.523.3810.940.120.215.670.090.04
      Coefficient of variation0.460.1200.230.220.210.040.160.430.340.24
      Concentration coefficient1.731.1000.751.210.761.840.877.261.250.88
      Background value7.000.08041.0015.0053.502.761.3013.000.250.15
      Anomaly threshold16.000.10065.0024.0078.003.001.8030.000.500.20
      Note: The elements were tested in the Zhengzhou Mineral Resources Supervision and Testing Center, Ministry of Natural Resources. Au, 10–9, others, 10–6.
       | Show Table
      DownLoad: CSV
    • Table 6.  Correlation of soil geochemical elements in the Nyasirori gold deposit.
      ElementsCuPbZnMoAgWAsSbBiAu
      Cu1
      Pb0.341
      Zn0.610.251
      Mo0.230.600.111
      Ag0.230.400.180.711
      W–0.19–0.02–0.200.010.031
      As0.300.260.360.280.19–0.071
      Sb0.460.540.490.510.33–0.090.731
      Bi–0.110.07–0.150.06–0.030.08–0.12–0.101
      Au0.170.070.280.150.11–0.050.710.48–0.041
       | Show Table
      DownLoad: CSV
    • Table 7.  Integrated geological-geophysical-geochemical prospecting model for the Nyasirori gold deposit.
      Exploration methodProspecting indicatorsMineralization indicator characteristics or information
      Regional settingGeological structure locationNorthwestern of Tanzanian Craton
      Middle and western ends of the Archean Musoma-Mara greenstone belt
      Regional geophysical fieldIn a weak negative magnetic anomaly zone
      GeologyGeological strata and lithologyNyanzian mafic volcanic-sedimentary rocks
      TectonicsMultiple groups and multiple directions (near east-west, north-west and north-east), and the near-east-west shear tectonic belt is the main ore-bearing structure
      Magmatic rockPost-orogenic biotite granite
      Wallrock alterationSilicification, chlorite, carbonation and sericitization
      Characteristics of ore bodiesGold ore bodies are present in the shear structural alteration zone, which are irregular veins, with local expansion and contraction, branching and refraction, and other phenomena
      Ore mineralsNatural gold, pyrite, arsenopyrite, limonite and a small amount of pyrrhotite, chalcopyrite
      Direct prospecting signArtisan mining pit and surface or near-surface oxidation zone, grayish yellow or purple-yellow, honeycomb structure oxidized ore generally good in gold
      GeophysicsRegional geophysical fieldStrong negative magnetic anomaly is a northwestward linear band-like distribution associated with diabase
      Low-weak magnetic field is associated with non-magnetic-micromagnetic greenstone formations
      Detection targetTectonic fracture zone
      Target physical property characteristicsRock alteration magnetic weakening
      Medium and low resistivity, weak polarization
      Surface anomaly characteristicsηs anomalies and ρs anomalies are basically the same as those of the surface gold mineralization alteration belts
      The ∆T micromagnetic anomaly has the characteristics of weak and small magnetic field changes, and the gradient band between positive and negative has great correlation between the tectonic alteration zone and the gold vein
      GeochemistryGold orebody element distributionAu, As, Sb elements are unevenly distributed in space. There is a tendency of local enrichment or depletion. Au, Sb elements are characterized by enrichment and the As element is highly enriched
      Mineral-induced elemental anomaly combinationAu-Ag-Cu-Pb-Zn-As-Sb-W-Mo-Bi
      Abnormal shape of main elementsThe abnormal elements of soil measurement are mainly Au, As, Sb, Cu and Zn, and the anomalies are irregular and the long axis direction is near
      Distribution rangeEast-west, in which Au, As, Sb are large in scale, high in intensity, and concentrated in center, inner, top and outer bands
      Distinct features, well-fitted, close correlation of Au, As, Sb
       | Show Table
      DownLoad: CSV