
| Professional Committee of Rock and Mineral Testing Technology of the Geological Society of China, National Geological Experiment and Testing Center | Host |

| Citation: |
LI Lijun, LIU Qiang. Distribution Characteristics and Source Analysis of “Three Nitrogen” in Shallow Groundwater in Hailun Area of Heilongjiang Province[J]. Rock and Mineral Analysis, 2023, 42(4): 809-822. doi: 10.15898/j.ykcs.202208270160

|
Distribution Characteristics and Source Analysis of “Three Nitrogen” in Shallow Groundwater in Hailun Area of Heilongjiang Province
-
Abstract
BACKGROUND With the increase of population, urbanization development, the large discharge of industrial wastewater and the excessive application of agricultural nitrogen fertilizer, the problem of “three nitrogen” (nitrate nitrogen, ammonia nitrogen, and nitrite nitrogen) pollution in groundwater has become increasingly serious. Due to the slow flow, weak alternation degree and poor self-purification ability, the nitrogen polluted groundwater is difficult to rehabilitate and the repair cost is high. It is of great practical significance to carry out prevention and control from the pollution source. With the concealment, complexity and hysteretic groundwater pollution property, it is difficult to conduct the source analysis of nitrate in groundwater. Positive matrix factorization (PMF) model, as a new type of source analysis model, has more interpretable and clear physical significance in terms of factor load and source factor score. At present, the application of the PMF model in the source analysis of “three nitrogen” in groundwater media is rarely reported, and the research in this field needs to be deepened. Gas-phase molecular absorption spectrometry is a practical analytical method for nitrogen compounds with high accuracy, wide linear range without color and turbidity interference. This method does not require chemical separation, and uses few chemical reagents and innoxious reagents. At present, this method has been widely used in the analysis and determination of water quality, nitrite nitrogen, ammonia nitrogen, nitrate nitrogen, total nitrogen, and other substances.
OBJECTIVES To identify the source and distribution characteristics of the “three nitrogen” in shallow groundwater in the Hailun area.
METHODS (1) Determination of “three nitrogen” and other elements in groundwater samples. With GPS coordinates, the 40 shallow groundwater samples were collected in Helen River Basin and Zaying River Basin. The collection and preservation of groundwater samples were performed in accordance with the environmental standards HJ/T 164—2004, HJ/T 195—2005, HJ/T 197—2005 and the ecological industry standards DZ/T 0064—2021. The quality control of the “three nitrogen” test in groundwater was based on the requirements of the national standard GB/T 14848—2017, the technical requirements for analytical quality control of groundwater pollution investigation (DD 2014-15), and the specification of testing quality management for geological laboratories (DZ/T 0130—2006). Each batch contained twenty samples and the test process of each batch was equipped with laboratory blank, reference materials, laboratory duplicate samples and quality control of external monitoring samples. All of the laboratory blank results were less than 2 times the detection limit of the method. The added standard recovery rate of the sample matrix was between 80%-120%, with the relative deviation (RD) of the laboratory repeat samples under 15%. The qualified rate of external quality control sample was 100%. (2) Analysis of detection data. Statistics and analysis of “three nitrogen”, heavy metal content correlation and principal components in groundwater were carried out using WPS Office 2016 and SPSS 22.0. The spatial distribution map of “three nitrogen” content in groundwater was obtained by CoreDRAW X5.0 software. The Ⅲ class water criterion in Standard for Groundwater Quality (GB/T 14848—2017) was used as the criterion for drinking water source and industrial and agricultural water. The Nemerow pollution index was calculated and compared with the corresponding grade standard index. The PMF model was used to identify and quantify the contribution rate of each nitrogen source to comprehensively judge the source of “three nitrogen”.
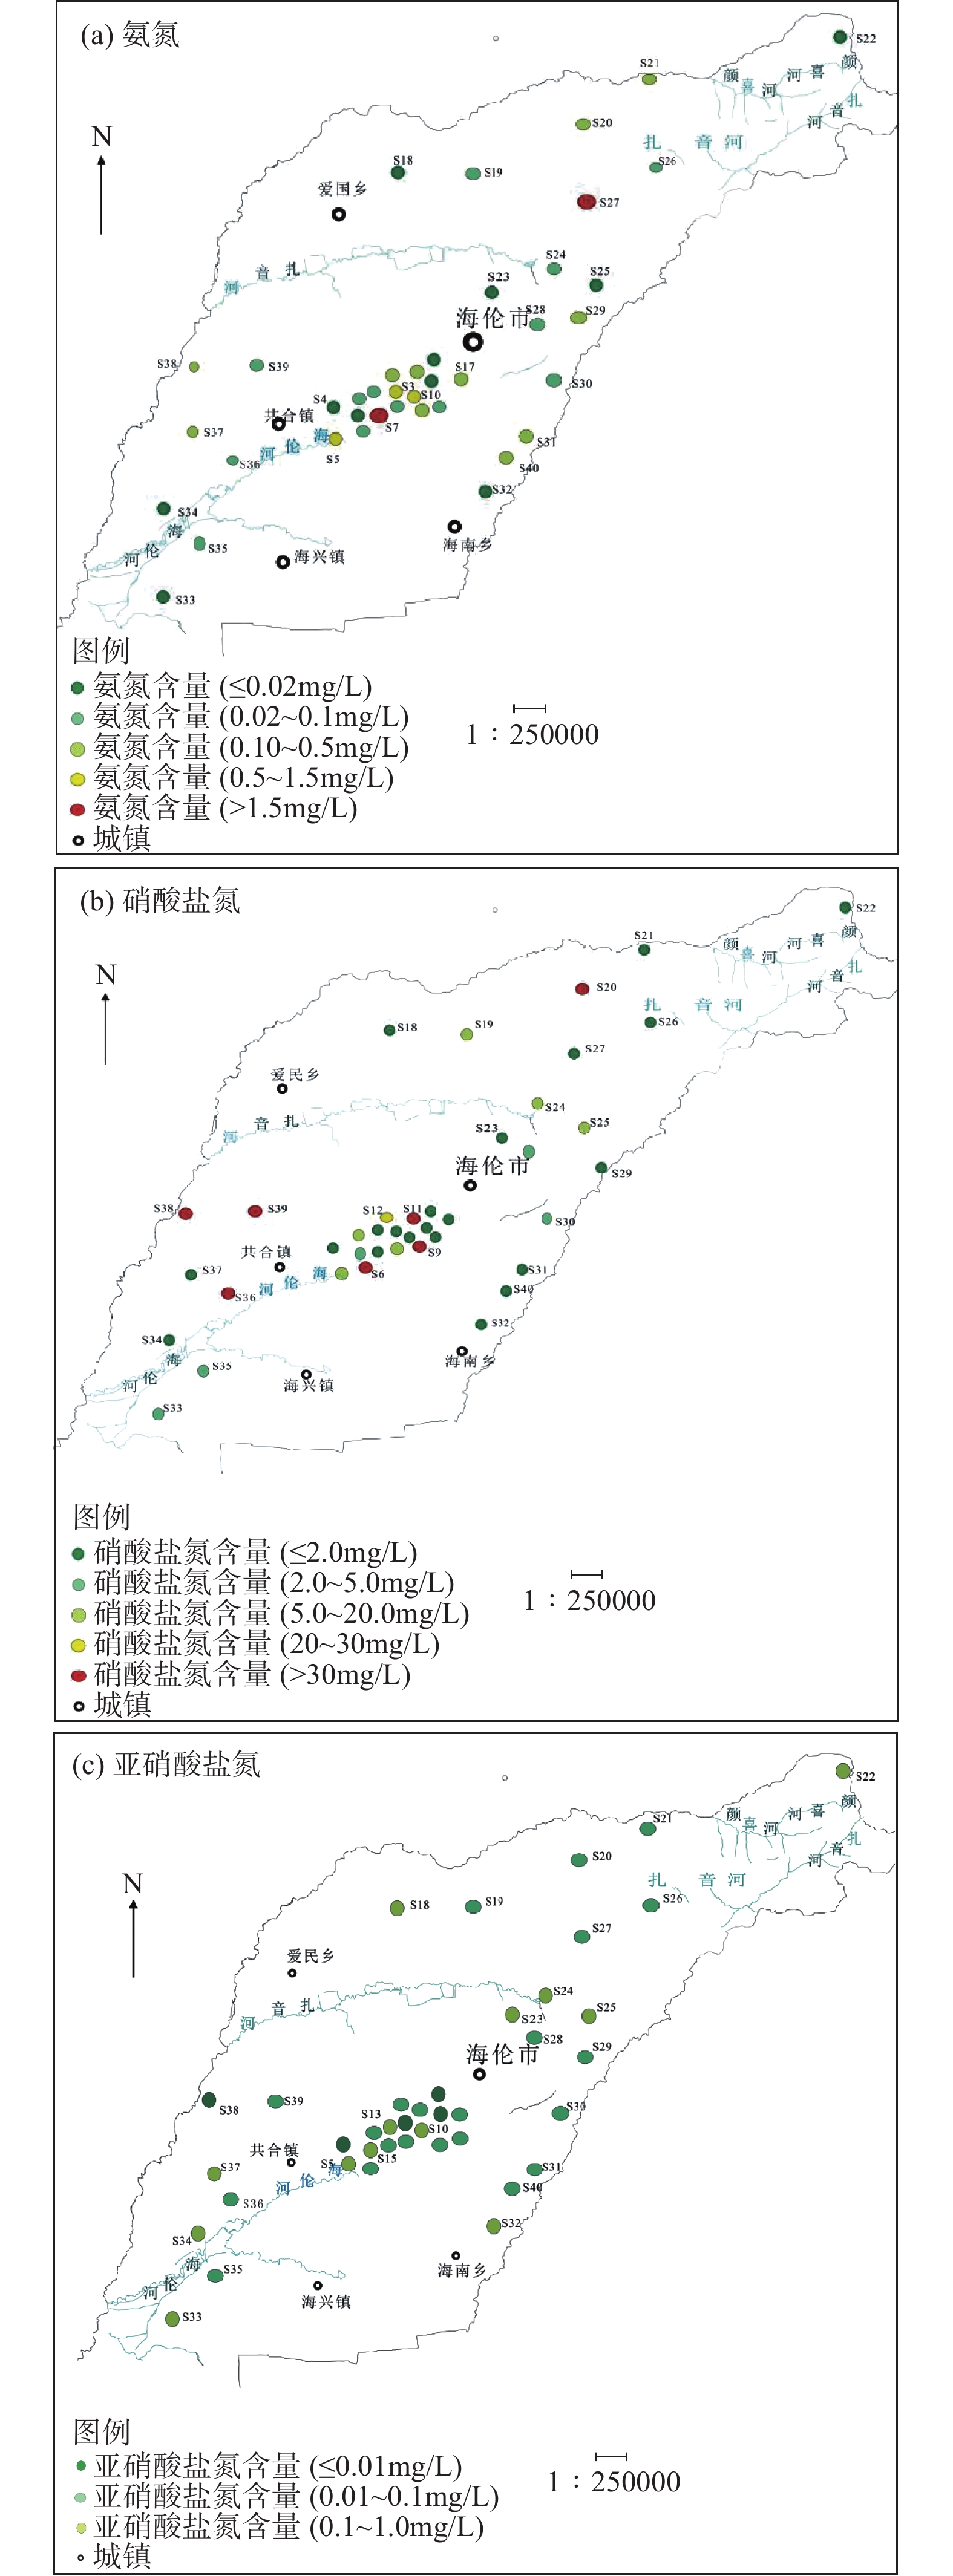
RESULTS (1) The contents of “three nitrogen” and other elements in the groundwater samples in the study area were determined. According to the contents of “three nitrogen” and related parameters shown in Table 3, the detection rates of the nitrate nitrogen, ammonia nitrogen and nitrite nitrogen were 100%, 77.5% and 90.0%, respectively. The maximum detection content of nitrate nitrogen was 123.05mg/L, and average content was 15.27mg/L. The maximum detection content of ammonia nitrogen was 3.91mg/L, and average content was 0.33mg/L. The maximum detection content of nitrite nitrogen was 0.65mg/L, and average content was 0.12mg/L. Compared with the Ⅲ class water criterion, the nitrate nitrogen over standard rate was 20%, with the maximum value 6.18 times; the ammonia nitrogen over standard rate was 12.5%, with its maximum value 7.8 times; the nitrite nitrogen did not exceed the Ⅲ class water criterion. The content of Mn was ND-3.20mg/L, and the proportion of Mn in I-III class water range was 40%. The contents of 8 heavy metals including Cd were within 10 times the detection limit, with 100% Ⅰ-Ⅲ class water. The content of anion F− was 0.029-0.69mg/L. The content of anion Cl− ranged from 0.0027 to 310mg/L, with the 97.5% Ⅰ-Ⅲ class and 2.5% over standard rate. The content of SO4 2− was 0.46-433mg/L, with the 95% Ⅰ-Ⅲ class and 5% over standard rate. (2) The pollution and spatial distribution of groundwater were studied. The results of Nemerow comprehensive pollution evaluation showed that the pollution degree of “three nitrogen” in the study area was relatively low. The proportion of unpolluted samples, mild pollution samples, heavy pollution samples and serious pollution samples was 65%, 25%, 2.5% and 0, respectively (Table 4). “Three nitrogen” spatial distribution is shown in Fig.1a-c. Samples with ammonia nitrogen content ranging in Ⅰ-Ⅲ class water was mainly concentrated in the north, west, east and central; the Ⅳ class water samples were concentrated in the middle; the class V water samples were concentrated in the center. Fig.1a shows the trend of high ammonia nitrogen in the middle and low ammonia nitrogen on both sides. In Fig.1b, Ⅰ-Ⅲ class water samples of nitrate nitrogen were mainly concentrated in the central, east and north, with the Ⅳ class water in the middle and the class V water in the west. The samples with the highest and sub highest nitrate nitrogen content were located in the center of the study area, radially distributing along the Helen River Basin and the Zaying River Basin. The nitrate nitrogen content was high near the central area, with the low content far from the central area. The nitrite nitrogen in Fig.1c was Ⅰ-Ⅲ class water. The spatial distribution of the nitrite nitrogen shows the trend of high in the north and low in the south along the Helen River Basin. (3) Multivariate statistical analysis and source of “three nitrogen” in groundwater were studied. Multivariate statistical analysis of Pearson correlation coefficient showed that nitrate nitrogen had some homology with Cd, Co, Ni. Nitrate nitrogen in groundwater was significantly correlated with Cl− and SO4 2−, while ammonia nitrogen and nitrite nitrogen showed no correlation with anion. Sample detection data imported into EPA PMF5.0 software for PMF source analysis, and the industrial source, agricultural source, living source and natural factor source were taken as the four source analysis factors of “three nitrogen” in the groundwater in the study area. The PMF source analysis results are presented in Table 6 and Fig.2. The main sources of “three nitrogen” in the groundwater in the study area were the compound source of living and industrial source, which further indicated that human activity was the root cause of “three nitrogen” pollution in the groundwater in Helen area. According to the spatial distribution of “three nitrogen” in groundwater, the highest point of nitrate nitrogen pollution was distributed in the center of the research area, with the relatively developed human life and industrial activities in this area. The ammonia nitrogen pollution samples were related to the dense human activities in the middle of the study area. The over-standard area of nitrate nitrogen was higher than the ammonia nitrogen, which indicated that the compound source of living and industrial source was the main factor affecting the “three nitrogen” content in the groundwater in study area.
CONCLUSIONS The nitrate nitrogen and ammonia nitrogen are the nitrogen pollution components in the groundwater in the study area. Compared with the water index in groundwater quality standard (GB/T 14848—2017), the over standard rates of the nitrate nitrogen and ammonia nitrogen are 20% and 12.5% respectively. The groundwater quality with pollution evaluation grade I (unpolluted) to grade Ⅲ (moderate polluted)accounts for 92.5%, which indicates relatively light pollution. The spatial distribution of ammonia nitrogen in the study area shows a trend of high in the middle and low on both sides. Nitrate nitrogen and ammonia nitrogen pollution samples are mainly distributed in the center of the intensive human activity research area. The quantitative analysis results of the “three nitrogen” PMF analysis model show that the compound source of living and industry are the main source of nitrate nitrogen pollution in the study area, and the compound source of living and agricultural production is the main source of ammonia nitrogen pollution. Combining the situation with the source of the “three nitrogen” pollution in the research area, the project of the “three nitrogen” pollution prevention can be carried out to strengthen protection, sustainable development and utilization of groundwater resources in the Helen area.
-

-
References
[1] 杜新强,方敏,冶雪艳. 地下水“三氮”污染来源及其识别方法研究进展[J]. 环境科学, 2018, 39(11): 5266−5275. Du X Q,Fang M,Ye X Y. Research progress on the sources of inorganic nitrogen pollution in groundwater and identification methods[J]. Environmental Science, 2018, 39(11): 5266−5275. [2] 张涵,李奇翎,郭珊珊,等. 成都平原典型区地下水污染时空异质性及污染源分析[J]. 环境科学学报, 2019, 39(10): 3516−3527. Zhang H,Li Q L,Guo S S,et al. Spatial temporal heterogeneity and pollution sources of groundwater pollution in typical area of Chengdu Plain[J]. Acta Scientiae Circumstantiae, 2019, 39(10): 3516−3527. [3] 李谨丞,曹文庚,潘登,等. 黄河冲积扇平原浅层地下水中氮循环对砷迁移富集的影响[J]. 岩矿测试, 2022, 41(1): 120−132. Li J C,Cao W G,Pan D,et al. Influences of nitrogen cycle on arsenic enrichment in shallow groundwater from the Yellow River Alluvial Fan Plain[J]. Rock and Mineral Analysis, 2022, 41(1): 120−132. [4] 付坤. 超深层地下水中“三氮”的迁移转化规律研究[D]. 焦作: 河南理工大学, 2018: 49−50. Fu K. Study on the migration and trans formation of NH4 +, NO2 −, and NO3 − in super deep groundwater[D]. Jiaozuo: Henan Polytechnic University, 2018: 49−50. [5] 张晓沛. 再生水回灌区地下水水化学特征及三氮迁移模拟[D]. 北京: 中国地质大学(北京), 2017: 58−59. Zhang X P. The water chemical characteristics of groundwater and the simulation of nitrogen migration in the irrigation area of reclaimed water[D]. Beijing: China University of Geosciences (Beijing), 2017: 58−59. [6] 傅雪梅. 基于水化学和同位素的地下水硝酸盐源解析研究[D]. 上海: 上海大学, 2019. Fu X M. Groundwater nitrate source identification based on hydrochemical and isotopes[D]. Shanghai: Shanghai University, 2019. [7] 常文博,李凤,张媛媛,等. 元素分析-同位素比值质谱法测量海洋沉积物中有机碳和氮稳定同位素组成的实验室间比对研究[J]. 岩矿测试, 2020, 39(4): 535−545. doi: 10.15898/j.cnki.11-2131/td.202003090027 Chang W B,Li F,Zhang Y Y,et al. Inter-laboratory comparison of measuring organic carbon and stable nitrogen isotopes in marine sediments by elemental analysis-isotope ratio mass spectrometry[J]. Rock and Mineral Analysis, 2020, 39(4): 535−545. doi: 10.15898/j.cnki.11-2131/td.202003090027 [8] 张涵,杜昕宇,高菲,等. 联合PMF模型与稳定同位素的地下水污染溯源[J]. 环境科学, 2022, 43(8): 4054−4063. Zhang H,Du X Y,Gao F,et al. Groundwater pollution source identification by combination of PMF model and stable isotope technology[J]. Environmental Science, 2022, 43(8): 4054−4063. [9] 刘楠涛,吴飞,袁巍,等. 长江与黄河源丰水期地表水中汞的分布特征、赋存形态及来源解析[J]. 环境科学, 2022, 43(11): 5064−5072. doi: 10.13227/j.hjkx.202201143 Liu N T,Wu F,Yuan W,et al. Mercury speciation,distribution,and potential sources in surface waters of the Yangtze and Yellow River source basins of Tibetan Plateau during wet season[J]. Environmental Science, 2022, 43(11): 5064−5072. doi: 10.13227/j.hjkx.202201143 [10] 陈盟,潘泳兴,黄奕翔,等. 阳朔典型铅锌矿区流域土壤重金属空间分布特征及来源解析[J]. 环境科学, 2022, 43(10): 4545−4555. doi: 10.13227/j.hjkx.202201127 Chen M,Pan Y X,Huang Y X,et al. Spatial distribution and sources of heavy metals in soil of a typical lead-zinc mining area,Yangshuo[J]. Environmental Science, 2022, 43(10): 4545−4555. doi: 10.13227/j.hjkx.202201127 [11] 许燕颖,刘友存,张军,等. 赣江上游典型流域水体三氮及重金属空间分布特征与风险评价[J]. 地球与环境, 2020, 48(5): 574−583. doi: 10.14050/j.cnki.1672-9250.2020.48.070 Xu Y Y,Liu Y C,Zhang J,et al. Spatial distribution and risk assessment of nitrogen and heavy metals in typical watershed of the upper reaches of Ganjiang River[J]. Earth and Environment, 2020, 48(5): 574−583. doi: 10.14050/j.cnki.1672-9250.2020.48.070 [12] 吴昊,朱红霞,袁懋,等. 气相分子吸收光谱法测定土壤中铵态氮和硝态氮的含量[J]. 岩矿测试, 2021, 40(1): 165−171. Wu H,Zhu H X,Yuan M,et al. Determination of ammonium nitrogen and nitrate nitrogen in soil by gas phase molecular absorption spectrometry[J]. Rock and Mineral Analysis, 2021, 40(1): 165−171. [13] 蓝天杉. 北京通州区浅层地下水中“三氮”迁移转化与弱透水层阻滞作用研究[D]. 长春: 吉林大学, 2019. Lan T S. The transportation and transformation of “Three Nitrogen” in shallow groundwater and the retarding effect of aquitard in Tongzhou, Beijing[D]. Changchun: Jilin University, 2019. [14] 田辉. 基于SWAT与Visual Modflow的海伦市水资源模拟与合理配置研究[D]. 长春: 吉林大学, 2020. Tian H. Research on water resources simulation and reasonable allocation of Hailun City based on SWAT and Visual Modflow[D]. Changchun: Jilin University, 2020. [15] 曹文庚,杨会峰,南天,等. 南水北调中线受水区保定平原地下水质量演变预测研究[J]. 水利学报, 2020, 51(8): 924−935. Cao W G,Yang H F,Nan T,et al. Prediction of groundwater quality evolution in the Baoding Plain of the SNWDP benefited regions[J]. Journal of Hydraulic of Engineering, 2020, 51(8): 924−935. [16] 雷正国,陶月赞. 地下水水源地水质评价方法探讨[J]. 节水灌溉, 2019(8): 80−83. Lei Z G,Tao Y Z. Discussion on water quality assessment method for groundwater source[J]. Water Saving Irrigation, 2019(8): 80−83. [17] 吴娟娟,卞建民,万罕立,等. 松嫩平原地下水氮污染健康风险评估[J]. 中国环境科学, 2019, 39(8): 3493−3500. Wu J J,Bian J M,Wan H L,et al. Health risk assessment of groundwater nitrogen pollution in Songlnen Plain[J]. China Environmental Science, 2019, 39(8): 3493−3500. [18] 李天宇,董宏志,孔庆轩,等. 松嫩平原哈尔滨地区地下水环境背景值分析[J]. 水文, 2016, 36(3): 24−28,74. Li T Y,Dong H Z,Kong Q X,et al. Background values of groundwater environment in Harbin area of Songnen Plain[J]. Journal of China Hydrology, 2016, 36(3): 24−28,74. [19] 李圣品,李文鹏,殷秀兰,等. 全国地下水质分布及变化特征[J]. 水文地质工程地质, 2019, 46(6): 1−8. doi: 10.16030/j.cnki.issn.1000-3665.2019.06.01 Li S P,Li W P,Yin X L,et al. Distribution and evolution characteristics of national groundwater quality from 2013 to 2017[J]. Hydrogeology & Engineering Geology, 2019, 46(6): 1−8. doi: 10.16030/j.cnki.issn.1000-3665.2019.06.01 [20] 孙小淇. 武进区地表水水质分布特征及其氮污染来源解析研究[D]. 上海: 华东理工大学, 2020: 19-24. Sun X Q. Investigations on distribution of water quality and sources tracing of nitrogen pollution in Wujin District surface water[D]. Shanghai: East China University of Science and Technology, 2020: 19-24. [21] 庞园,李志威,张明珠. 广花盆地地下水三氮时空分布特征及影响因素分析[J]. 生态环境学报, 2018, 27(5): 916−925. doi: 10.16258/j.cnki.1674-5906.2018.05.017 Pang Y,Li Z W,Zhang M Z. Analysis of spatial-temporal distribution and influencing factors of three-nitrogen in groundwater of Guanghua Basin[J]. Ecology and Environmental Sciences, 2018, 27(5): 916−925. doi: 10.16258/j.cnki.1674-5906.2018.05.017 [22] 左朝晖. 北京东北部平原区地下水氮素污染源解析及其贡献率研究[D]. 石家庄: 河北地质大学, 2020. Zuo Z H. Source analysis and contribution rate of groundwater nitrogen pollution in the plain area of Northeast Beijing[D]. Shijiazhuang: Hebei GEO University, 2020. [23] 张鑫. 地表水、地下水硝酸盐时空变化及其来源分析[D]. 西安: 西北大学, 2021. Zhang X. Spatiotemporal variation and source analysis of nitrate in surface water and groundwater: Guanzhong section of Wei River Basin[D]. Xi’an: Northwest University, 2021. [24] 吕晓立,刘景涛,朱亮,等. 兰州市地下水中“三氮”污染特征及成因[J]. 干旱区资源与环境, 2019, 33(1): 95−100. doi: 10.13448/j.cnki.jalre.2019.015 Lyu X L,Liu J T,Zhu L,et al. Distribution and source of nitrogen pollution in groundwater of Lanzhou City[J]. Journal of Arid Land Resources and Environment, 2019, 33(1): 95−100. doi: 10.13448/j.cnki.jalre.2019.015 [25] 李桂芳,杨恒,叶远行,等. 高原湖泊周边浅层地下水:氮素时空分布及驱动因素[J]. 环境科学, 2022, 43(6): 3027−3036. doi: 10.13227/j.hjkx.202109195 Li G F,Yang H,Ye Y X,et al. Shallow groundwater around plateau lakes:Spatiotemporal distribution of nitrogen and its driving factors[J]. Environmental Science, 2022, 43(6): 3027−3036. doi: 10.13227/j.hjkx.202109195 [26] Viktor Y, Еlena V, Valentin R. Influence of ammonium nitrogen on the treatment efficiency of underground water at iron removal stations[J]. Groundwater for Sustainable Development, 2023(22): 100943. [27] Ashu R, Kiran P, Ramet M, et al. Hydrochemical characteristics and potential health risks of nitrate, fluoride, and uranium in Kota district, Rajasthan, India[J]. Environmental Science and Pollution Research, 2023: 1−21. [28] 何宝南,何江涛,孙继朝,等. 区域地下水污染综合评价研究现状与建议[J]. 地学前缘, 2022, 29(3): 51−63. doi: 10.13745/j.esf.sf.2022.1.29 He B N,He J T,Sun J Z,et al. Comprehensive evaluation of regional groundwater pollution:Research status and suggestions[J]. Earth Science Frontiers, 2022, 29(3): 51−63. doi: 10.13745/j.esf.sf.2022.1.29 [29] 韩彬,林法祥,丁宇,等. 海州湾近岸海域水质状况调查与风险评价[J]. 岩矿测试, 2019, 38(4): 429−437. doi: 10.15898/j.cnki.11-2131/td.201806190073 Han B,Lin F X,Ding Y,et al. Quality survey and risk assessment of the coastal waters of Haizhou Bay[J]. Rock and Mineral Analysis, 2019, 38(4): 429−437. doi: 10.15898/j.cnki.11-2131/td.201806190073 [30] 罗飞,巴俊杰,苏春田,等. 武水河上游区域土壤重金属污染风险及来源分析[J]. 岩矿测试, 2019, 38(2): 195−203. doi: 10.15898/j.cnki.11-2131/td.201806040069 Luo F,Ba J J,Su C T,at al. Contaminant assessment and sources analysis of heavy metals in soils from the upper reaches of the Wushui River[J]. Rock and Mineral Analysis, 2019, 38(2): 195−203. doi: 10.15898/j.cnki.11-2131/td.201806040069 [31] 郭涛,陈海洋,滕彦国,等. 东北典型农产区流域地下水水质评价与污染源识别[J]. 北京师范大学学报(自然科学版), 2017, 53(3): 316−322. Guo T,Chen H Y,Teng Y G,et al. Pollution assessment and source identification of basin groundwater in typical agricultural areas in Northeast China[J]. Journal of Beijing Normal University (Natural Science), 2017, 53(3): 316−322. [32] 洪慧,李娟,汪洋,等. 基于统计学方法的地下水水质评价与成因分析——以齐齐哈尔市为例[J]. 环境工程技术学报, 2019, 9(4): 431−439. doi: 10.12153/j.issn.1674-991X.2019.04.160 Hong H,Li J,Wang Y,et al. Groundwater quality evaluation and causes analysis based on statistical methods:Taking Qiqihar City as an example[J]. Journal of Environmental Engineering Technology, 2019, 9(4): 431−439. doi: 10.12153/j.issn.1674-991X.2019.04.160 [33] 马小雪,龚畅,郭加汛,等. 长江下游快速城市化地区水污染特征及源解析:以秦淮河流域为例[J]. 环境科学, 2021, 42(7): 3291−3303. doi: 10.13227/j.hjkx.202011184 Ma X X,Gong C,Guo J X,et al. Water pollution characteristics and source apportionment in rapid urbanization region of the lower Yangtze River:Considering the Qinghai River catchment[J]. Environmental Science, 2021, 42(7): 3291−3303. doi: 10.13227/j.hjkx.202011184 [34] Guo W J, Zhang Z Y, Wang H, et al. Exposure characteristics of antimony and coexisting arsenic from multi-path exposure in typical antimony mine area[J]. Journal of Environmental Management, 2021: 112493. [35] Zhu Y, Yang J, Wang L, et al. Factors influencing the uptake and speciation transformation of antimony in the soil-plant system, and the redistribution and toxicity of antimony in plants[J]. Science of the Total Environment, 2020: 140232. [36] Wang Y Z, Duan X J, Wang L. Spatial distribution and source analysis of heavy metals in soils influenced by industrial enterprise distribution: Case study in Jiangsu Province[J]. Science of the Total Environment, 2020: 134953. -
Access History
Figures(2)
Tables(6)

Export File
Citation
LI Lijun, LIU Qiang. Distribution Characteristics and Source Analysis of “Three Nitrogen” in Shallow Groundwater in Hailun Area of Heilongjiang Province[J]. Rock and Mineral Analysis, 2023, 42(4): 809-822. doi: 10.15898/j.ykcs.202208270160
Format
Content
 DownLoad:

-
Figure 1.
Schematic diagrams of groundwater sampling points and “three nitrogen” content in the study area. a—ammonia nitrogen; b—nitrate nitrogen; c—nitrite nitrogen.
-
Figure 2.
Contribution rate of each factor based on PMF to the distribution of three nitrogen and heavy metals in the groundwater. Factor 1—Living-industrial compound source; Factor 2—Natural source; Factor 3—Agricultural source; Factor 4—Domestic source.