
| Professional Committee of Rock and Mineral Testing Technology of the Geological Society of China, National Geological Experiment and Testing Center | Host |
| Citation: |
ZHANG Tao, WANG Xiao-fei, LI Shuang, DENG Ping-ye. Study on Influencing Factors in Determining Pore Characteristics of Shale by Mercury Intrusion[J]. Rock and Mineral Analysis, 2016, 35(2): 178-185. doi: 10.15898/j.cnki.11-2131/td.2016.02.010

|
Study on Influencing Factors in Determining Pore Characteristics of Shale by Mercury Intrusion
-
Abstract
Mercury intrusion is a common method for the determination of pore characteristics of shale, but the measurement results are affected by a number of factors, such as sample size and measuring range. The pore characteristics of shale and synthetic materials were analyzed under different contact angles, sample sizes and measuring ranges, all of which are reported in this paper. Porosity was related to the measuring range, and high precision results were acquired when the measuring range was between 7.1 nm and 100 μm. The fractures produced during sample preparation may have increased the porosity. Compared with synthetic samples, the mean pore diameter, the porosity and the specific pore volume of the shale were strongly influenced by the sample size, within a certain measurement range. Reducing the sample size of shale, not only increased the connectivity between the small pores, but also reduced the impact of large fractures. The mean pore diameter increased by 35% when the contact angle increased from 130° to 150°. Therefore, in order to improve the accuracy and comparability of the results, the measurement should be performed using small sample sizes and exact contact angle. Meanwhile it is necessary to further perfect the test standard concerning the measurement of pore characteristics of shale by mercury intrusion.
-
Keywords:
- mercury intrusion /
- shale /
- sample size /
- contact angle /
- porosity
-

-
References
[1] [2] [3] [4] [5] [6] [7] [8] Comisky J T, Santiago M, McCollom B, et al. Sample Size Effects on the Application of Mercury Injection Capillary Pressure for Determining the Storage Capacity of Tight Gas and Oil Shales[C]//Canadian Unconventional Resources Conference. Canada: Society of Petroleum Engineers, 2011, SPE Paper 149432. [9] [10] doi: 10.1073/pnas.7.4.115
[11] [12] [13] [14] [15] [16] [17] [18] [19] [20] [21] [22] -
Access History
Figures(3)
Tables(2)

Export File
Citation
ZHANG Tao, WANG Xiao-fei, LI Shuang, DENG Ping-ye. Study on Influencing Factors in Determining Pore Characteristics of Shale by Mercury Intrusion[J]. Rock and Mineral Analysis, 2016, 35(2): 178-185. doi: 10.15898/j.cnki.11-2131/td.2016.02.010
Format
Content
 DownLoad:
-
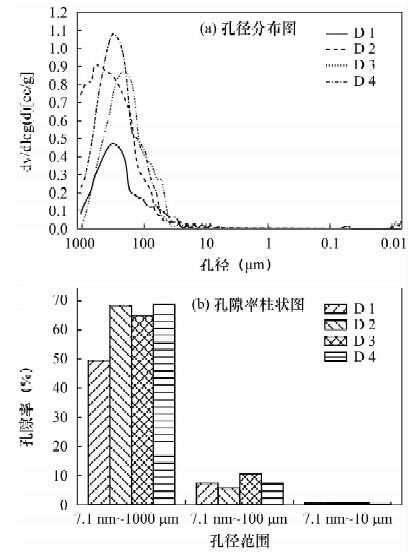
Figure 1.
(a)Pore size distribution curves of D1-D4 samples, (b)Porosity histogram under different pore-size ranges of D1-D4 samples
-
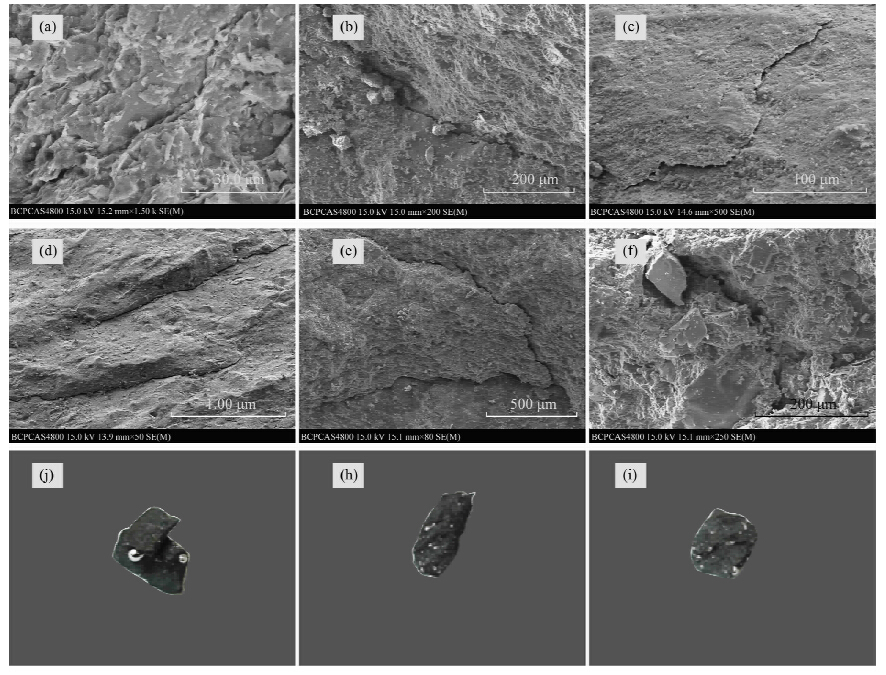
Figure 2.
Fracture of SEM photos (a-f), and sample photos after mercury intrusion test (g-i)
-
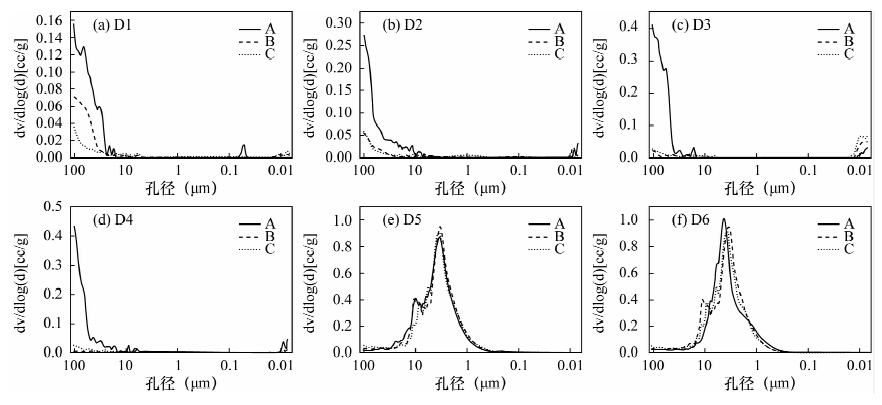
Figure 3.
Pore size distribution under different sample-size of D1-D6