
Citation: | LÜ Liuyan, QIAO Weitao, CHEN Ren, LI Jing, YU Ning, HU Xinrui, LIU Qin. 2023. Sedimentary age determination and palaeogeographic pattern of Neoproterozoic Qingshuijiang Formation in Central Guizhou Province[J]. Geology in China, 50(2): 521-532. doi: 10.12029/gc20190321003 |
This paper is the result of geological survey engineering.
The Qingshuijiang Formation in Kaiyang area of Central Guizhou is a set of epimetamorphic terrigenous clastic rocks intercalated with pyroclastic rocks, which formed at the margin of the Yangtze block in Neoproterozoic. In order to accurately determining the depositional age, the provenance and the paleogeographic pattern of the Qingshuijiang Formation, the sedimentary characteristics of terrigenous clastic rocks and the chronology of pyroclastic rocks are studied in this paper.
Based on the detailed geological survey, the detrital zircon U-Pb age of the tuffites at the top of this Formation was determined by LA-ICP-MS analysis, and the regional stratigraphic correlation was carried out.
Zircon U-Pb ages are divided into two groups, 2488-1821 Ma in Paleoproterozoic and 838-779 Ma in Neoproterozoic, respectively, with a weighted average of (802±24) Ma for the youngest age group. The statistical results of pyroclastic content shows that the magma activity in this period has obvious episodic distribution and periodicity. Regional stratigraphic correlation results show that the exposure nature of the Qingshuijiang Formation in Kaiyang area is similar to Tongren and Yinjiang area, and may be equivalent to the bottom of the Qingshuijiang Formation in southeast Guizhou area.
The latest depositional age limit of the Qingshuijiang Formation in Central Guizhou is about 800 Ma. The provenance mainly comes from Sichuan-Yunnan-Guizhou region on the western margin of the Yangtze Landmass. and the abundant volcanics may come from the second to third episodes of tectonic magmatic activity during the breakup of the supercontinent in the middle Neoproterozoic. The sea-land conversion occurred in the subsequent Xuefeng movement, and formed an ancient land extending in the northeast with a higher distribution of altitude in the south than the north, which established the paleogeographic framework of the Nanhua period in the middle Neoproterozoic.
Regional aridity is increasing under global climate change, and therefore the sustainable use of water resources has drawn attention from scientists and the public (Yin LH et al., 2015; Zhang GF et al., 2003). In arid regions, groundwater is the main source of water supply for urban, industrial and agricultural development due to unreliability and over-allocation of surface water (Simmers I, 2013). Due to unsustainable development, groundwater depletion has taken place widely in large-scale regional aquifers (Scanlon BR et al., 2012; Feng W et al., 2013; Doell P et al., 2014). Groundwater recharge/percolation, therefore, is essential to the sustainable use of groundwater, particularly in arid regions (Scanlon BR et al., 2006; Huang TM, et al., 2017). Percolation is defined as water movement below the root zone, whereas recharge is used to describe water that reaches the water table. However, the two terms are often equated to each other (Scanlon BR et al., 2002). Although many methods are available to estimate groundwater recharge/percolation, for example, Water-balance Methods, Empirical Formulae, Isotope-tracer Techniques, and Darcian Approaches, quantification of recharge fluxes in arid regions remains challenging due to the complex process, the strong spatial and temporal variations and the preferential flow (Yin LH et al., 2011; Federico AF and Geoff P, 2010).
Among the existing methods, Tracer Methods are effective and have the best potential for reliable point estimation of groundwater recharge in arid regions where groundwater recharge is very low, i.e., less than 1 mm/a in extreme cases (Scanlon BR et al., 2002; Chen ZY et al., 2001; Chen ZY et al., 1998; Cook PG et al., 1992). The most commonly used tracer-based method is the chloride mass balance (CMB) method because of its low cost and time integrating properties (Wood WW, 1999; Chen Z and Xu H, 1996; Liu XY et al., 2010), requiring only information of chloride in precipitation, groundwater or soil water (Crosbie RS et al., 2017; Perera N et al., 2013; Russo SL et al., 2003). The application of the CMB method can be traced back in the 1940s (Anderson VG, 1945), and it has been widely used since then in (semi-) arid regions, including USA (Tyler SW et al, 1996; Scanlon BR et al, 2007), Australia (Stone WJ, 1992; Harrington GA, et al., 2002; Tolmie PE et al., 2011) and China (Gates JB et al., 2008b). Other tracers, such as sulfate (SO4) and fluoride, have also been used to estimate groundwater recharge in limited cases (Scanlon BR et al., 2006; Adane ZA and Gates JB, 2015), providing that they are not absorbed by soils. However, the applicability of these ions to estimate groundwater recharge needs more cases to validate and groundwater recharge estimated by two tracer-based methods is seldom compared.
Land-use changes have significant impacts on groundwater recharge as indicated by previous studies (Allison GB and Hughes MW, 1983; Cook PG et al., 2001) as vegetation changes associated with land-use alternation ranks the second controlling factor on groundwater recharge (Wang YG et al., 1993; Kim JH and Jackson RB, 2012; Wang Q et al., 2013). The most common land-use change is the conversion of natural lands for agriculture that has been practiced worldwide to meet the increasing food demand (Tilman D et al., 2011; Ma QL et al., 2009; Schmidt S et al., 2013), which has a substantial impact on groundwater recharge (Scanlon BR et al., 2005). The previous studies indicate that land-clearing for the crop has increased groundwater recharge in order of magnitude (Allison GB and Hughes RW, 1983; Han D et al., 2017). Since the 1950s, croplands in arid northwestern China have expanded remarkably to provide sufficient food production and to promote economic growth. In these areas, croplands have increased by 4800 km2 from 1987 to 2000 according to the study on land-use change by remote sensing (Yan HM et al., 2009) and keep increasing after 2000 when other areas in China are experiencing reduction with respect to cropland areas (Zhang ZH et al., 1997; Zuo LJ et al., 2018). In some specific sites, the rate of cropland increase is even faster. In an inland arid Heihe River Basin, the results show that the cultivated croplands along oasis fringes increased by 15.38% and 43.60% during the period of 1965–1986 and 1986–2007, respectively (Nian YY et al., 2014). Several studies on the impact of land-use changes on groundwater recharge have been conducted in (semi-) arid regions (Wang BG et al., 2006; Zhu GF et al., 2007; Huang TM et al. 2017). However considering the vast area of NW China (about 3.3×10⁶ km2) with various climate, soil, and vegetation, quantitative assessments on the impact by previous studies are still inadequate.
In this study, the northern slope of the Tianshan Mountain in NW China was selected as the study area where soil profiles were excavated in natural and agricultural lands and groundwater recharge was estimated based on the chloride- and sulfate-based tracer methods. The main objectives are: (1) To quantify groundwater recharge under different land use; (2) To compare the changes after the conversion from natural lands to croplands; and (3) To validate the applicability of the sulfate-based tracer method to quantify groundwater recharge.
The study site is located on the northern slope of the Tianshan Mountain, covering an area of about 2300 km2. The southern study area is a mountainous region (800−4000 m above sea level), the middle region is covered by oases (450−500 m above sea level) and the northern part is characterized by a desert landscape (440−460 m above sea level) (Fig. 1). Mean annual precipitation varies between 220 mm (M1 station, 1961−2014 from http://data.cma.cn/) and 173 mm (M2 station, 2006−2015 from the local meteorological Bureau) (Fig. 2). The majority of rainfall (about 64%) occurs in the period April through September, mainly in a form of thunderstorm. Air temperature ranges from 26.1℃ in July to –19.1℃ in January, with a mean value of 7.0℃ at M1 station. Potential evapotranspiration at M1 station is about 1960 mm/a, exceeding annual precipitation greatly.
Land-use is mainly natural grasslands and shrublands (47%), croplands (33%), and water bodies and cities (10% in total) (Zhang Q et al., 2017). Croplands are mainly irrigated by groundwater due to the scarcity of precipitation and surface water resources and cover an area of about 200 km2. Flooding irrigation was mainly used at the early land development stage and has been converted to dipping irrigation recently for water-saving. The thickness of the vadose zone is higher in the mountainous areas (about 70 m) and lower in the oasis and desert (about 5−10 m). Groundwater is mainly stored in Quaternary unconsolidated porous aquifers and flows toward the north. Groundwater quality is good with total dissolved solids ranging from 500 mg/L to 1000 mg/L.
Precipitation chemistry is monitored by China Acid Deposition Monitoring Network (Fig. 3). The nearest monitoring station is in Urumqi (about 60 km northwest of the study area) where long-term data of wet-only deposition are available for 11 years (1999−2009) (Fig. 3). Volume-weighted mean wet annual chloride (Cl)- and SO42- concentrations are 8.8 mg/L and 30.4 mg/L, respectively.
Four pits (Fig. 1), two under irrigated croplands and two under natural lands, were dug into a depth ranging from 5.7 m to >9 m ( Table 1) and a direct push rig was used to take soil core samples at 0.2 m intervals. TP1 and TP2 are in natural lands, one in oasis partially covered by grass and the other in the desert without any vegetation on the surface. TP3 and TP4 are in croplands with melon and sunflower, respectively. The amount of flooding irrigation is about 620 mm/a and 675 mm/a at TP3 and TP4, respectively (Local Statistical Bureau) and Cl- concentration in irrigation water is 21 mg/L and 33 mg/L at TP3 and TP4, respectively.
Profile | Vegetation type | Longitude | Latitude | Elevation/m | Core depth/m | Numbers of samples | Water table depth/m |
TP1 | Grass | E88°05’18” | N44°15’56” | 498 | 5.8 | 29 | 5.9 |
TP2 | / | E88°04’39” | N44°21’5” | 472 | 8.8 | 44 | >9.0 |
TP3 | Melon | E88°05’44” | N44°12’58” | 508 | 6.4 | 32 | 6.5 |
TP4 | Sunflower | E87°57’39” | N44°11’58” | 511 | 5.7 | 29 | 5.8 |
Note: Data from the laboratory of Xi'an Center of China Geological Survey. |
The samples were sectioned for the analyses of particle size, soil moisture, chloride and stable water isotopes. Particle-size distributions were determined by the sieving method for the sand fractions and by a soil hydrometer for the silt and clay fractions. Gravimetric soil water content was determined by weighing before and after oven-drying at 105℃. Chloride concentration in soil water was analyzed in water leached from soil samples. About 40 mL of double deionized water was added to 25 g of soil and the mixture was shaken for 4 h, centrifuged at 7000 rpm for 30 min until the visible separation of soil and water, and finally filtered. Cl- and SO42- concentrations were measured by ion chromatography (Dionex ICS-1100, Thermo Fisher Scientific Inc.), and were expressed on a mass basis and then were converted to mg/L by dividing gravimetric water content and multiplying by water density. Soil water was extracted by the high-temperature vacuum distillation method using a LI-2000 soil water extractor (Lijia Scientific instrument Inc., China). 18O and 2H were measured by a cavity ring-down spectrometer (L1102-i, Picarro, Inc., CA, USA) and were expressed in δ-notation with respect to VSMOW (Vienna Standard Mean Ocean Water).
The CMB method has been widely applied to estimate deep drainage (Huang TM et al., 2011). The basic assumptions of the method are as follows: (1) Chloride is conservative; (2) Atmospheric input is assumed to be constant with time; and (3) Water movement in thick vadose zones is vertically non-diffusive below the root zone. Surface runoff was ignored due to the low precipitation in the study area. In natural systems, the CMB method was used to determine deep drainage (D) as follows:
D=P×Clp+DcCluz | (1) |
where P is the annual precipitation (mm/a), Clp is the Cl- concentration in precipitation (mg/L), Cluz is the Cl- concentration in soil water (mg/L) and Dc is the dry deposition of chloride from other sources. The value of dry deposition is from the previous study with a similar environmental condition, reporting that the annual dry depositions for croplands and natural lands were about 0.66 g/m2 and 1.16 g/m2, respectively (Zhang N et al., 1999). When the CMB method is applied in irrigated lands, irrigation rate (I, mm/a) and Cl- concentration in irrigation water (ClI) must be included as following:
D=P×Clp+I×ClICluz | (2) |
The principal of the mass balance method can be applied to other elements if the input of a tracer can be quantified and the tracer behaves conservatively (Scanlon BR et al., 2002). In this study, SO42- was also used to estimate deep drainage, assuming no subsurface sources or sinks for SO42-, but the dry deposition of SO42- was ignored as no such data were available for the study area. Due to the possible existence of plant and microbial SO42- uptake (Taiz L and Zeiger E, 2010), the water washing coefficient (WWC) was calculated to valid the no sink assumption by Eq. 3 as following:
WWCi=ci−1ci | (3) |
where WWCi is the water washing coefficient in the ith layer (-), ci-1 (mg/L) and ci (mg/L) are the concentration of a tracer in layer i-1 and i, respectively. If WWC indicates that the adsorption of SO42- is negligible, then a similar equation to Eq. 1 and Eq. 2 can be written for the SO42--based deep drainage estimation.
By assuming a constant atmospheric input, the time required to accumulate a certain amount of Cl- in a profile (t) was determined by dividing the total mass of Cl- to the depth of the profile (Selaolo ET, 1998):
t=∫z0θCluzdz/(P×Clp) | (4) |
where θ is soil water content (cm3/cm3). Eq. 4 assumes a constant Cl- input from precipitation, which is supported by 36Cl/Cl- ratios in other sites (Scanlon BR et al., 2002). A similar equation can be used to calculate the accumulated age for the cropland profiles under the consumption of constant inputs from the atmosphere and irrigation.
The depth profiles of δ18O and δD of soil water are shown in Fig. 4. All profiles show strong enrichment at the top 2 m, indicating a strong evaporation loss from the top surface under high evaporation demand in arid regions (Torres EA and Calera A, 2010). The mean values of δ18O were –6.2‰ and –7.7‰ at TP1 and TP2, respectively, higher than the values in the croplands (–10.7‰ and –13.0‰ for TP3 and TP4, respectively). The more enriched signature implied that soil water suffered stronger evaporation at natural conditions than croplands. Beneath 2 m, the variation of δ18O and δD was narrow, less than 5‰ in δ18O and 20‰ in δD (Table 2; Fig. 4), suggesting a uniform piston flow.
δ18O | δD | ||||||||||||||
Depth/m | TP1 | Depth/m | TP2 | Depth/m | TP3 | Depth/m | TP4 | Depth/m | TP1 | Depth/m | TP2 | Depth/m | TP3 | Depth/m | TP4 |
0.2 | 3.18 | 0.2 | –2.54 | 0.2 | –9.88 | 0.1 | –7.52 | 0.2 | –37.83 | 0.2 | –68.34 | 0.2 | –90.08 | 0.1 | –71.77 |
0.4 | –1.66 | 0.4 | –1.77 | 0.4 | –3.26 | 0.3 | –11.14 | 0.4 | –68.04 | 0.4 | –72.03 | 0.4 | –46.50 | 0.3 | –87.97 |
0.6 | –4.53 | 0.6 | –8.19 | 0.6 | –7.79 | 0.5 | –12.70 | 0.6 | –78.37 | 0.6 | –96.50 | 0.6 | –75.06 | 0.5 | –98.64 |
0.8 | –6.36 | 0.8 | –6.29 | 0.8 | –10.16 | 0.7 | –14.92 | 0.8 | –79.58 | 0.8 | –87.22 | 0.8 | –88.11 | 0.7 | –98.03 |
1 | –6.73 | 1 | –11.59 | 1 | –10.51 | 0.9 | –14.91 | 1.0 | –76.34 | 1.0 | –108.31 | 1.0 | –94.37 | 0.9 | –97.57 |
1.2 | –8.13 | 1.2 | –9.67 | 1.2 | –12.85 | 1.1 | –11.86 | 1.2 | –78.61 | 1.2 | –105.06 | 1.2 | –99.55 | 1.1 | –91.68 |
1.4 | –7.49 | 1.4 | –5.67 | 1.4 | –12.79 | 1.3 | –13.79 | 1.4 | –78.51 | 1.4 | –82.79 | 1.4 | –96.10 | 1.3 | –105.33 |
1.6 | –9.10 | 1.6 | –9.86 | 1.6 | –13.41 | 1.5 | –15.19 | 1.6 | –85.65 | 1.6 | –95.47 | 1.6 | –99.96 | 1.5 | –112.93 |
1.8 | –11.01 | 1.8 | –9.53 | 1.8 | –13.06 | 1.7 | –16.61 | 1.8 | –91.34 | 1.8 | –103.69 | 1.8 | –103.33 | 1.7 | –108.86 |
2 | –10.59 | 2 | –11.89 | 2 | –12.90 | 1.9 | –11.25 | 2.0 | –92.24 | 2.0 | –115.57 | 2.0 | –99.59 | 1.9 | –91.89 |
2.2 | –10.79 | 2.2 | –13.07 | 2.2 | –10.64 | 2.1 | –9.56 | 2.2 | –88.59 | 2.2 | –124.10 | 2.2 | –85.76 | 2.1 | –77.21 |
2.4 | –11.42 | 2.4 | –10.03 | 2.4 | –10.65 | 2.3 | –15.54 | 2.4 | –94.96 | 2.4 | –104.59 | 2.4 | –81.60 | 2.3 | –100.39 |
2.6 | –13.44 | 2.6 | –12.53 | 2.6 | –11.47 | 2.5 | –14.23 | 2.6 | –105.78 | 2.6 | –114.06 | 2.6 | –89.40 | 2.5 | –107.72 |
2.8 | –12.24 | 2.8 | –8.16 | 2.8 | –12.81 | 2.7 | –13.78 | 2.8 | –97.37 | 2.8 | –89.83 | 2.8 | –94.49 | 2.7 | –104.02 |
3 | –11.88 | 3 | –9.41 | 3 | –12.96 | 2.9 | –11.07 | 3.0 | –89.79 | 3.0 | –96.45 | 3.0 | –96.59 | 2.9 | –83.68 |
3.2 | –11.67 | 3.2 | –9.33 | 3.2 | –13.94 | 3.1 | –13.88 | 3.2 | –87.26 | 3.2 | –94.99 | 3.2 | –102.61 | 3.1 | –89.91 |
3.4 | –14.69 | 3.4 | –8.22 | 3.4 | –14.00 | 3.3 | –14.00 | 3.4 | –104.18 | 3.4 | –96.18 | 3.4 | –94.11 | 3.3 | –102.57 |
3.6 | –15.25 | 3.6 | –8.76 | 3.6 | –13.29 | 3.5 | –13.96 | 3.6 | –107.56 | 3.6 | –92.32 | 3.6 | –102.58 | 3.5 | –110.47 |
3.8 | –14.10 | 3.8 | –9.03 | 3.8 | –12.99 | 3.7 | –12.50 | 3.8 | –104.31 | 3.8 | –88.75 | 3.8 | –101.63 | 3.7 | –96.10 |
4 | –11.28 | 4 | –10.68 | 4 | –12.62 | 3.9 | –11.41 | 4.0 | –87.24 | 4.0 | –104.77 | 4.0 | –95.04 | 3.9 | –89.89 |
4.2 | –12.32 | 4.2 | –9.03 | 4.2 | –12.20 | 4.1 | –13.89 | 4.2 | –92.19 | 4.2 | –102.19 | 4.2 | –88.46 | 4.1 | –84.39 |
4.4 | –12.86 | 4.4 | –9.32 | 4.4 | –14.73 | 4.3 | –13.91 | 4.4 | –94.96 | 4.4 | –92.00 | 4.4 | –108.40 | 4.3 | –108.65 |
4.6 | –13.63 | 4.6 | –10.50 | 4.6 | –13.52 | 4.5 | –14.35 | 4.6 | –99.77 | 4.6 | –95.40 | 4.6 | –103.84 | 4.5 | –106.96 |
4.8 | –12.83 | 4.8 | –10.15 | 4.8 | –13.08 | 4.7 | –14.46 | 4.8 | –95.96 | 4.8 | –93.75 | 4.8 | –102.48 | 4.7 | –106.05 |
5 | –12.34 | 5 | –9.77 | 5 | –11.95 | 4.9 | –10.46 | 5.0 | –94.69 | 5.0 | –96.09 | 5.0 | –92.47 | 4.9 | –80.20 |
5.2 | –12.16 | 5.2 | –10.44 | 5.2 | –11.61 | 5.1 | –13.61 | 5.2 | –88.65 | 5.2 | –97.39 | 5.2 | –82.63 | 5.1 | –84.93 |
5.4 | –13.55 | 5.4 | –10.86 | 5.4 | –13.90 | 5.3 | –13.90 | 5.4 | –97.44 | 5.4 | –95.88 | 5.4 | –107.26 | 5.3 | –103.76 |
5.6 | –14.97 | 5.6 | –9.91 | 5.6 | –14.01 | 5.5 | –17.38 | 5.6 | –105.54 | 5.6 | –94.42 | 5.6 | –102.68 | 5.5 | –110.91 |
5.8 | –14.42 | 5.8 | –11.01 | 5.8 | –13.36 | 5.7 | –12.91 | 5.8 | –102.95 | 5.8 | –95.10 | 5.8 | –91.56 | 5.7 | –92.57 |
6 | –12.04 | 6 | –13.75 | 6.0 | –102.84 | 6.0 | –92.35 | ||||||||
6.2 | –11.15 | 6.2 | –10.81 | 6.2 | –101.43 | 6.2 | –86.39 | ||||||||
6.4 | –10.36 | 6.4 | –12.24 | 6.4 | –96.19 | 6.4 | –88.13 | ||||||||
6.6 | –11.04 | 6.6 | –109.10 | ||||||||||||
6.8 | –11.36 | 6.8 | –98.40 | ||||||||||||
7 | –10.11 | 7.0 | –102.30 | ||||||||||||
7.2 | –13.26 | 7.2 | –105.29 | ||||||||||||
7.4 | –12.48 | 7.4 | –96.44 | ||||||||||||
7.6 | –12.17 | 7.6 | –102.46 | ||||||||||||
7.8 | –14.19 | 7.8 | –110.15 | ||||||||||||
8 | –10.99 | 8.0 | –102.28 | ||||||||||||
8.2 | –13.94 | 8.2 | –108.93 | ||||||||||||
8.4 | –15.23 | 8.4 | –109.79 | ||||||||||||
8.6 | –12.01 | 8.6 | –96.24 | ||||||||||||
8.8 | –11.46 | 8.8 | –91.14 |
Compared to the local meteoric water line (LMWL) (Wei J et al. 2011), the slope of the vadose zone water line is lower than that of LMWL (about 7.2) (Table 3; Fig. 5). The slopes for TP1 and TP2 are similar, being 3.3 and 3.2 respectively (Table 3; Fig. 5). The slopes for the profiles in croplands are slightly higher than that in natural lands (4.8 and 4.3 for TP3 and TP4, respectively) (Table 3; Fig. 5). The lower values of the slope in natural lands indicate that stronger evaporation is present, which agrees with the inference from the depth profiles of δ18O and δD.
TP1 | TP2 | TP3 | TP4 | ||||
δ18O | δD | δ18O | δD | δ18O | δD | δ18O | δD |
3.18 | –37.83 | –2.54 | –68.34 | –9.88 | –90.08 | –7.52 | –71.77 |
–1.66 | –68.04 | –1.77 | –72.03 | –3.26 | –46.50 | –11.14 | –87.97 |
–4.53 | –78.37 | –8.19 | –96.50 | –7.79 | –75.06 | –12.70 | –98.64 |
–6.36 | –79.58 | –6.29 | –87.22 | –10.16 | –88.11 | –14.92 | –98.03 |
–6.73 | –76.34 | –11.59 | –108.31 | –10.51 | –94.37 | –14.91 | –97.57 |
–8.13 | –78.61 | –9.67 | –105.06 | –12.85 | –99.55 | –11.86 | –91.68 |
–7.49 | –78.51 | –5.67 | –82.79 | –12.79 | –96.10 | –13.79 | –105.33 |
–9.10 | –85.65 | –9.86 | –95.47 | –13.41 | –99.96 | –15.19 | –112.93 |
–11.01 | –91.34 | –9.53 | –103.69 | –13.06 | –103.33 | –16.61 | –108.86 |
–10.59 | –92.24 | –11.89 | –115.57 | –12.90 | –99.59 | –11.25 | –91.89 |
–10.79 | –88.59 | –13.07 | –124.10 | –10.64 | –85.76 | –9.56 | –77.21 |
–11.42 | –94.96 | –10.03 | –104.59 | –10.65 | –81.60 | –15.54 | –100.39 |
–13.44 | –105.78 | –12.53 | –114.06 | –11.47 | –89.40 | –14.23 | –107.72 |
–12.24 | –97.37 | –8.16 | –89.83 | –12.81 | –94.49 | –13.78 | –104.02 |
–11.88 | –89.79 | –9.41 | –96.45 | –12.96 | –96.59 | –11.07 | –83.68 |
–11.67 | –87.26 | –9.33 | –94.99 | –13.94 | –102.61 | –13.88 | –89.91 |
–14.69 | –104.18 | –8.22 | –96.18 | –14.00 | –94.11 | –14.00 | –102.57 |
–15.25 | –107.56 | –8.76 | –92.32 | –13.29 | –102.58 | –13.96 | –110.47 |
–14.10 | –104.31 | –9.03 | –88.75 | –12.99 | –101.63 | –12.50 | –96.10 |
–11.28 | –87.24 | –10.68 | –104.77 | –12.62 | –95.04 | –11.41 | –89.89 |
–12.32 | –92.19 | –9.03 | –102.19 | –12.20 | –88.46 | –13.89 | –84.39 |
–12.86 | –94.96 | –9.32 | –92.00 | –14.73 | –108.40 | –13.91 | –108.65 |
–13.63 | –99.77 | –10.50 | –95.40 | –13.52 | –103.84 | –14.35 | –106.96 |
–12.83 | –95.96 | –10.15 | –93.75 | –13.08 | –102.48 | –14.46 | –106.05 |
–12.34 | –94.69 | –9.77 | –96.09 | –11.95 | –92.47 | –10.46 | –80.20 |
–12.16 | –88.65 | –10.44 | –97.39 | –11.61 | –82.63 | –13.61 | –84.93 |
–13.55 | –97.44 | –10.86 | –95.88 | –13.90 | –107.26 | –13.90 | –103.76 |
–14.97 | –105.54 | –9.91 | –94.42 | –14.01 | –102.68 | –17.38 | –110.91 |
–14.42 | –102.95 | –11.01 | –95.10 | –13.36 | –91.56 | –12.91 | –92.57 |
–12.04 | –102.84 | –13.75 | –92.35 | ||||
–11.15 | –101.43 | –10.81 | –86.39 | ||||
–10.36 | –96.19 | –12.24 | –88.13 | ||||
–11.04 | –109.10 | ||||||
–11.36 | –98.40 | ||||||
–10.11 | –102.30 | ||||||
–13.26 | –105.29 | ||||||
–12.48 | –96.44 | ||||||
–12.17 | –102.46 | ||||||
–14.19 | –110.15 | ||||||
–10.99 | –102.28 | ||||||
–13.94 | –108.93 | ||||||
–15.23 | –109.79 | ||||||
–12.01 | –96.24 | ||||||
–11.46 | –91.14 |
Soil water contents (SWCs) in the oasis profile (TP1) fluctuated at a range of 10%−20% within 0–4 m, increased gradually from 20% to 35% below 4 m (Fig. 6a). The elevated soil water contents at TP1 near the bottom attributed to the capillary rise of water table where the depth to water table was about 6 m. In contrast, the top soil water contents at TP2 in the desert were similar to TP1, but soil water contents below 4 m were generally lower than 10% (Fig. 6a). The mean SWCs were 18.7% and 7.7% at TP1 and TP2 (Table 4), respectively, indicating that soil water was less in the desert due to the drier conditions and less precipitation.
Profile | Moisture content/(cm3/cm3) | Cl- concentration/(mg/ L) | Total Cl- storage/(g/m2) | SO42- concentration/(mg/L) | Total SO42- storage/(g/m2) | ||||||
Mean | Min | Max | Mean | Min | Max | Mean | Min | Max | |||
TP1 | 18.7 | 9.4 | 29.7 | 9169.3 | 4279.2 | 24354.5 | 9861.2 | 46907.6 | 11004.1 | 175435.4 | 29533.9 |
TP2 | 7.7 | 1.8 | 17.0 | 33904.7 | 14548.5 | 64989.1 | 28762.7 | 41372.3 | 3417.0 | 214988.2 | 30696.7 |
TP3 | 17.9 | 5.8 | 33.7 | 300.9 | 74.1 | 1044.8 | 326.2 | 1297.5 | 234.2 | 6162.9 | 741.0 |
TP4 | 22.4 | 9.2 | 35.0 | 457.4 | 98.0 | 1079.0 | 822.5 | 2569.5 | 1187.1 | 6809.3 | 4072.6 |
In the oasis, Cl- concentrations ranged from 4279.2 mg/L to 24354.5 mg/L with a mean value of 9169.3 mg/L (Table 4), and the peak value occurred at about 0.6 m depth (Fig. 6b). In the desert, the Cl- concentrations varied between 14548.5 mg/L and 64989.1 mg/L with a mean value of 33904.7 mg/L, and the Cl- contents of soil water were highest near the land surface at around 65000 mg/L. The total amount of accumulated Cl- over the entire profile of TP1 was equivalent to about 3500 years of rainfall Cl- input. In contrast, the total amount of accumulated Cl- in TP2 equaled to 10300 years of atmospheric deposition. Thus, the two profiles contain long records of climatic variation as seen in other dry sites (Radford BJ et al., 2009; Scanlon BR et al., 2007). The deep drainage under natural vegetation was low, ranging from 0.07 mm/a in the desert to 0.4 mm/a in the oasis from the CMB method.
WWCs of SO42- did not decrease with depth, indicating that SO42- was not absorbed by the soil (Fig. 7). Therefore, deep drainage was also estimated by the sulfate mass balance (SMB) method. In the oasis, SO42- ranged from 11004.1 mg/L to 175435.4 mg/L with a mean value of 46907.6 mg/L (Fig. 6c). In the desert, SO42- concentrations fluctuated significantly at the top 2 m, and then became stable. The deep drainage from the SMB method varied between 0.16 mm/a in the desert and 0.3 mm/a in the oasis. The deep drainage estimated by SO42- is generally consistent with the chloride-based estimation, suggesting that the SMB method can be used to estimated deep drainage at a relatively high precision (Scanlon BR et al., 2010).
Soil water contents along the two cropland profiles were similar, showing a fluctuation with depth, but generally increased with depth (Fig. 8a). The mean soil water contents were 17.9% and 22.4% for TP3 and TP4, respectively. Soil water Cl- contents of the two profiles followed a similar pattern, showing an increase from the surface and reaching the maximum of about 1000 mg/L and then decreasing and being stable at 2−3 m (Fig. 8b). The mean Cl- contents at TP3 and TP4 were 300.9 mg/L and 457.4 mg/L, respectively, much lower than that in natural lands. Based on Eq. 2, the deep drainage under croplands ranged from 61.2 mm/a in TP3 to 44.8 mm/a in TP4.
The concentrations of SO42- at the two profiles generally decreased with depth and reached stable values at 2−3 m depth (Fig. 8c). The deep drainage under croplands ranged from 95.6 mm/a in TP3 to 24.5 mm/a in TP4 by the SMB method, which was consistent with the results from the CMB method. The use of SO42- to estimate groundwater recharge is uncommon and only three cases were reported in the USA and China (Scanlon BR et al., 2006; Adane ZA and Gates JB, 2015). This study further indicates that SO42- has promise as an independent check on the results from the CMB method and can be used at natural lands and croplands.
Deep drainage rates usually do not exceed 3 mm/a at natural conditions in arid regions of Northwest China (Ma JZ et al., 2005, 2009b; Edmunds WM et al., 2006; Gates JB et al., 2008b). For example, the mean recharge under 18 unsaturated zone profiles in the Badain Jaran Desert in NW China is 1.4 mm/a (Gates JB et al., 2008a), and groundwater recharge ranges from 0.9 mm/a to 2.5 mm/a in the eastern part of the Hexi Corridor and western part of the Tengger Desert (Ma JZ et al., 2009a). Besides China, in Australia, the United States and Africa, many studies have shown that under natural ecosystems groundwater recharge is little or no recharge (Scanlon BR et al., 2007). These studies, in general, have a good agreement with this study. However recharge at TP2 is extremely low (0.07 mm/a), which may result from the presence of clay in the upper 4 m, because previous studies indicate that variations in deep drainage are related to soil texture (Allison GB and Hughes MW, 1983; Kennett-Smith A et al., 1994; Keese KE et al., 2005; Wang T et al., 2009; Kim JH and Jackson RB, 2012). A modeling study shows that soil textural variability reduces recharge by factors of 2–11 (Keese KE et al., 2005) and clay contents in the upper soil profile can be used as a surrogate to regionalize deep drainage rates beneath cleared areas on the basis of high correlations between deep drainage and clay contents (Kennett-Smith A et al., 1994).
As croplands have the highest water input, including precipitation and irrigation, groundwater recharge is highest among croplands, grasslands, woodlands, and scrublands (Kim JH and Jackson RB, 2012). But, groundwater recharge under croplands is highly variable across the world. A mean average deep drainage rate for croplands is about 10.0 mm/a (0.1 mm/a to 50.0 mm/a) in southern Australia (Cook PG et al., 2001), while it is up to 205.0 mm/a for the irrigated farmland in Italy. Deep drainage rates have been estimated for approximately 50 profiles in China using the CMB method. For example, deep drainage rates for the irrigated farmlands range from 31.3 mm/a to 65.0 mm/a in the North China Plain (Wang BG et al., 2006) and from 47.0 mm/a to 50.0 mm/a in arid areas of Northwest China (Huang TM et al., 2013) respectively, which is similar to those at TP3 and TP4 (61.2 mm/a and 44.8 mm/a, respectively).
Groundwater recharge at natural lands and croplands in this study indicates that it increases dramatically after the conversion from the former to the latter, which has a good agreement with previous studies reporting the increase at one to two orders of magnitude (Allison GB and Hughes MW, 1983; Scanlon BR et al., 2006). There are two possible reasons. Firstly, the introduced irrigation water to meet the rainfall deficit increases the amount of potential water sources that can become groundwater. The amount of water applied using the traditional flooding irrigation may be comparable or exceed the annual precipitation (Wang BG, et al., 2008). Secondly, in (semi-) arid regions, native plans usually have deep roots to obtain deep soil moisture (Jackson RB et al., 1996), particularly trees that use both soil water and groundwater (Yin LH et al., 2013). Groundwater recharge will significantly increase after replacing with short-rooted crops that reduce evapotranspiration (Radford BJ et al., 2009). The global analysis depicts that groundwater recharge will triple after the conversion of woodland to croplands under a water-limited condition (Kim JH and Jackson RB, 2012).
About 3.14×10⁶ km2 worldwide are irrigated croplands (Salmon JM et al., 2015). There are two types of irrigation, i.e., groundwater-fed (30%) and surface water-fed (70%) (Wada Y et al., 2014). In many arid regions, groundwater has been one of the major irrigation water sources and is expected to further increase due to overused surface and reduced reliability of precipitation. Although groundwater recharge in croplands increases after conversion, its amount is much lower than the pumping rate in most cases, which results in a continuous decline of the water table. For example, the water table in North China Plain and High Plains Aquifer in the United States has lowered more than 40 m due to groundwater pumping for irrigation (Cao GL et al., 2016; Lauffenburger ZH et al., 2018). In NW China, croplands are usually in the oasis-desert settings. The lowering of the water table will cause the dieback of phreatophytes in the edge of deserts and the spread of desertification, in addition to the depletion of groundwater resources. Due to water table decline, the belt width of Tamarix between the oasis and the desert decreases remarkably from 1000 m to about 30 m in inland basin of NW China (Ma JZ et al., 2009b).
For irrigation using surface water, the water table will rise significantly due to the increased groundwater recharge, which will result in serious soil salinization (Smedema LK and Shiati K, 2002). The total global area of salt-affected soils was 8.31×10⁶km2, extending over all the continents including Africa, Asia, Australasia, and the Americas (Martinez-Beltran J and Manzur CL, 2005). In China, the total area of salinization is about 0.36×10⁶km2, mainly in (semi-) arid regions, due to excessive irrigation (Li JG et al., 2014). Irrigation-induced recharge can increase the chemical load to the soil and mobilize the existing salt inventories accumulated during the geological history (McMahon PB et al., 2006; Robertson WM et al., 2015; Turkeltaub T et al., 2015), which degrades water quality. For instance, groundwater nitrate concentration increased by 0.7−0.9 mg/L over periods ranging from 10 years to over 50 years due to land-use changes (Robertson WM and Sharp JM., 2015). In the study, the deterioration of groundwater quality is not observed, which may be due to the small percentage of irrigation lands (about 10%). Groundwater quality degradation is expected under a scenario that large-scale cultivation occurs. For both groundwater- and surface water-fed irrigation, water-saving technologies should be applied to enhance water use efficiency to minimize the negative effect on soil and plants. Numerical modeling indicates that under drip irrigation, water use efficiency will be increased by up to 77% (Hu QL et al., 2017)
Regional aridity is increasing under global climate change, and therefore the sustainable use of water resources has drawn attention from scientists and the public. In this study, two tracer-based methods, i.e., chloride and sulfate, were applied to quantify groundwater recharge under different land use. In the natural lands, groundwater recharge is negligible, ranging from 0.07 mm/a to 0.40 mm/a. In contrast, groundwater recharge increase dramatically up to 44.80−61.20 mm/a after the conversion.
The estimated groundwater recharge indicates that the conversion of natural lands to croplands has resulted in substantial increases in groundwater recharge, indicating that land-use changes can significantly alter groundwater resources in a given region.
The study also suggests that the sulfate mass balance method yields result similar to that from the chloride mass balance method, indicating that sulfate can be used as an alternative tracer to quantify groundwater recharge in arid regions.
The research was funded by Innovation Capability Support Program of Shaanxi (2019TD-040), China National Natural Science Foundation (41472228, 41877199), Groundwater and Ecology Security in the North Slope Economic Belt of the Tianshan Mountain (201511047) and Key Laboratory of Groundwater and Ecology in Arid Regions of China Geological Survey.
Chen Jianshu, Dai Chuangu, Peng Chenglong, Lu Dingbiao, Wang Xuehua, Wang Min, Bao Lixin, Zhang Deming, Luo Shan. 2016. Study on stratigraphical division and correlation of the neoproterozoic "Xiajiang group" in Hunan, Guizhou and Guangxi Province: Discuss on the reboot of Xiajiang system[J]. Geological Review, 62(5): 1093-1114 (in Chinese with English abstract). |
Chen Yuelong, Luo Zhaohua, Zhao Junxiang, Li Zhihong, Zhang Hongfei, Song Biao. 2004. Petrogenesis and dating of the the Kangding complexes, Sichuan Province[J]. Science in China (Ser. D), 34(8): 687-697 (in Chinese). |
Compston W, Williams I S, Kirschvink J L, Zhang Z, Ma G. 1992. Zircon U-Pb ages for the Early Cambrian time-scale[J]. Journal of the Geological Society, 149(2): 171-184. doi: 10.1144/gsjgs.149.2.0171 |
Dai Chuangu, Hu Mingyang, Wang Min, Chen Jianshu, Wang Xuehua. 2015. The important geologic events of Guizhou Province and its geologic significance[J]. Guizhou Geology, 32(1): 1-14 (in Chinese with English abstract). doi: 10.3969/j.issn.1000-5943.2015.01.001 |
Dai Chuangu, Wang Min, Chen Jianshu, Wang Xuehua. 2013. Tectonic movement characteristic and its geological significance of Guizhou[J]. Guizhou Geology, 30(2): 119-124 (in Chinese with English abstract). doi: 10.3969/j.issn.1000-5943.2013.02.008 |
Deng Keyong, Wu Bo, Luo Mingxue, Luo Chun, Long Jianxi. 2015. Phosphate rock geochemistry of the Doushantuo Formation in Shuangshanping, Kaiyang of Guizhou Province and its genetic significance[J]. Geology and Exploration, 51(1): 123-132 (in Chinese with English abstract). |
Deng Qi, Wang Jian, Wang Zhengjiang, Cui Xiaozhuang, Shi Meifeng, Du Qiuding, Ma Long, Liao Shiyong, Ren Guangming. 2016. Middle Neoproterozoic magmatic activities and their constraints on tectonic evolution of the Jiangnan orogen[J]. Geotectonica et Metallogenia, 40(4): 753-771 (in Chinese with English abstract). |
Ernst R E, Wingate M T D, Buchan K L, Li Z X. 2008. Global record of 1600-700 Ma Large Igneous Provinces (LlPs): Implications for the reconstruction of the proposed Nuna (Columbia) and Rodinia supercontinents[J]. Precambrian Research, 160: 159-178. doi: 10.1016/j.precamres.2007.04.019 |
Gao Linzhi, Dai Chungu, Liu Yanxue, Wang Min, Wang Xuehua, Chen Jianshu, Ding Xiaozhong. 2010. Zircon SHRIMP U-Pb dating of the tuffaceous bed of Xiajiang Group in Guizhou Province and its stratigraphic implication[J]. Geology in China, 37(4): 1071-1082 (in Chinese with English abstract). doi: 10.3969/j.issn.1000-3657.2010.04.021 |
Guizhou Institute of Geological Survey. 2017. Regional Geology of China·Guizhou Province[M]. Beijing: Geological Publishing House, 1-127 (in Chinese). |
Li X H, Li Z X, Zhou H, Liu Ying, Peter D K. 2002. U-Pb zircon geochronology, geochemistry and Nd isotopic study of Neoproterozoic bimodal volcanic rocks in the Kangdian Rift of South China: Implications for the initial rifting of Rodinia[J]. Precambrian Research, 113: 135-155. doi: 10.1016/S0301-9268(01)00207-8 |
Li Xianhua, Li Zhengxiang, Sinclair James A, Li Wuxian, Garreth Carter. 2006. Revisiting the "Yanbian Terrane": Implications for Ncoproterozoic tectonic evolution of the western Yangtze Block, South China[J]. Precambrian Research, 151: 14-30. doi: 10.1016/j.precamres.2006.07.009 |
Li Xianhua, Zhou Hanwen, Li Zhengxiang, Liu Ying, Kinny P. 2001. Zircon U-Pb age and petrochemical characteristics of the Neoproterozoic bimodal volcanics from western Yangtze block[J]. Geochimica, 30(4): 315-322 (in Chinese with English abstract). doi: 10.3321/j.issn:0379-1726.2001.04.003 |
Lü Liuyan, Li Jing, Zeng Wentao, Yu Saiying, Sun Zaibo, Wang Xiaofeng. 2019. The discovery of Early Jurassic volcanic rocks along the Southern Lancangjiang tectonic magmatic belt in southwest Yunnan, with a discussion on the upper limit of Indosinian tectonic cycles in Yunnan Province[J]. Geology in China, 46(6): 1270-1283 (in Chinese with English abstract). |
Qin Yongjun, Du Yuansheng, Mou Jun, Lu Dingbiao, Long Jianxi, Wang Anhua, Zhang Housong, Zeng Changxing. 2015. Geochronology of neoproterozoic Xiajiang group in southeast Guizhou, South China, and its geological implications[J]. Earth Science-Journal of China University of Geosciences, 40(7): 1107-1120 (in Chinese with English abstract). doi: 10.3799/dqkx.2015.093 |
Qiu Y M, Gao S, McNaughton N J, D I Groves. Ling W L. 2000. First evidence of ≥ 3.2 Ga continental crust in the Yangtze craton of South China and its implications for Archean crustal evolution and Phanerozoic tectonics[J]. Geology, 28: 11-14. |
Shen Hongjuan, Gu Shangyi, Zhao Sifan, Wu Zhongyin, Feng Yong. 2020. The sedimentary geochemical records of ocean environment during the Nantuo (Marinoan) glaciation in South China——Carbon and oxygen isotopes and trace element compositions of dolostone in Nantuo Formation, Nanhuan System, in eastern Guizhou[J]. Geological Review, 66(1): 214-228 (in Chinese with English abstract). |
Stern R J. 2008. Neoproterozoic crustal growth: The solid Earth system during a critical episode of Earth history[J]. Gondwana Research, 14: 33-50. doi: 10.1016/j.gr.2007.08.006 |
Wang J, Li Z X. 2003. History of Neoproterozoic rift basins in South China: Implications for Rodinia break-up[J]. Precambrian Research, 122: 141-158. doi: 10.1016/S0301-9268(02)00209-7 |
Wang L J, Griffin W L, Yu J H, O'Reilly S Y. 2010. Precambrian crustal evolution of the Yangtze Block tracked by detrital zircons from Neoproterozoic sedimentary rocks[J]. Precambrian Research, 177(1/2): 131-144. |
Wang X L, Shu L S, Xing G F, Zhou J C, Tang M, Shu X J, Qi L, Hu Y H. 2012. Post-orogenic extension in the eastern part of the Jiangnan orogen: Evidence from ca 800-760 Ma volcanic rocks[J]. Precambrian Research, (222/223): 404-423. |
Wang X C, Li X H, Li Z X, Li Q L, Tang G Q, Gao Y Y, Zhang Q R, Liu Y. 2011. Episodic Precambrian crust growth: Evidence from U-Pb ages and Hf-O isotopes of zircon in the Nanhua Basin, central South China[J]. Precambrian Research, (222/223): 386-403. |
Wang Zhengjiang, Wang Jian, Duan Taizhong, Xieyuan, Zhuo Xiewen, Yang Ping. 2010. Geochronology of middle Neoproterozoic volcanic deposits in Yangtze Craton interior of South China and its implications to tectonic settings[J]. Science in China, 40(11): 1543-1551 (in Chinese with English abstract). |
Wei Yanan, Jiang Xinsheng, Cui Xiaozhaung, Zhuo Jiewen, Jiang Zhuofei, Cai Juanjuan. 2015. Detrital zircon U-Pb age of the neoproterozoic Qingshuijiang Formation in Southeastern Guizhou and their geological significance[J]. Mineral Petrology, 35(3): 61-71 (in Chinese with English abstract). |
Wu Yuanbao, Zheng Yongfei. 2004. Genetic mineralogy of zircon and its constraints on the interpretation of U-Pb age[J]. Chinese Science Bulletin, 16: 179-185 (in Chinese with English abstract). |
Yin Chongyu, Gao Linzhi. 2013. Definition, time limit and stratigraphic subdivision of the Nanhua System in China[J]. Journal of Stratigraphy, 37(4): 534-541 (in Chinese with English abstract). |
Yin Chongyu, Liu Yongqing, Gao Linzhi. 2007. Phosphatized Biota in Early Sinian (Ediearan): Wengan Biota and its Environment[M]. Beijing: Geological Publishing House, 1-126 (in Chinese with English title). |
Yuan Honglin, Gao Shan, Dai Mengning, Zong Chunlei, Detlef Günther, Gisela Helene Fontaine, Liu Xiaoming, DiWu Chunrong. 2008. Simultaneous determinations of U-Pb age, Hf isotopes and trace element compositions of zircon by excimer laser ablation quadrupole and multiple collector ICP-MS[J]. Chemical Geology, 247(1/2): 100-118. |
Zhang Qirui. 2014. Comment on the age 780 Ma at the lower boundary of the Nanhuan Period[J]. Journal of Stratigraphy, 38(3): 336-339 (in Chinese with English abstract). |
Zhang Yujie, An Xianyin, Liu Shilei, Gao Yongjuan, Zheng Jie, Sang Yongheng. 2020. The lithofaces, Mn-bearing sedimentary filling and palaeogeographic pattern of Early Datangpo Stage and implied for manganese in the northeastern Guizhou Province[J]. Geology in China, 47(3): 607-626 (in Chinese with English abstract). |
Zheng J P, Griffin W L, O'Reilly S Y, Zhang Ming. 2006. Widespread Archean basement beneath the Yangtze craton[J]. Geology, 34(6): 417-420. doi: 10.1130/G22282.1 |
Zheng Yongfei, Zhang Shaobing. 2007. Formation and evolution of the Precambrian continental crust in South China[J]. Chinese Science Bulletin, 52(1): 1-10 (in Chinese). doi: 10.1007/s11434-007-0015-5 |
Zheng Y F, Zhang S B, Zhao Z F, Wu Y B, Li X, Li Z, Wu F Y. 2007. Contrasting zircon Hf and O isotopes in the two episodes of Neoproterozoic granitoids in South China: Implications for growth and reworking of continental crust[J]. Lithos, 96: 127-150. doi: 10.1016/j.lithos.2006.10.003 |
Zhou Chuanming. 2016. Neoproterozoic lithostratigraphy and correlation across the Yangtze Block South China[J]. Journal of Stratigraphy, 40(2): 120-134 (in Chinese with English abstract). |
陈建书, 戴传固, 彭成龙, 卢定彪, 王雪华, 王敏, 包立新, 张德明, 骆珊. 2016. 湘黔桂地区新元古代"下江群"地层划分对比研究——重新启用下江系的探讨[J]. 地质论评, (5): 1093-1114. |
陈岳龙, 罗照华, 赵俊香, 李志红, 张宏飞, 宋彪. 2004. 从锆石SHRIMP年龄及岩石地球化学特征论四川冕宁康定杂岩的成因[J]. 中国科学(D辑): 地球科学, 34(8): 687-697. |
戴传固, 胡明扬, 陈建书, 王敏, 王雪华. 2015. 贵州重要地质事件及其地质意义[J]. 贵州地质, 32(1): 1-14. |
戴传固, 王敏, 陈建书, 王雪华. 2013. 贵州构造运动特征及其地质意义[J]. 贵州地质, 30(2): 119-124. |
邓克勇, 吴波, 罗明学, 罗春, 龙建喜. 2015. 贵州开阳双山坪陡山沱组磷块岩地球化学特征及成因意义[J]. 地质与勘探, 51(1): 123-132. |
邓奇, 王剑, 汪正江, 崔晓庄, 施美凤, 杜秋定, 马龙, 廖世勇, 任光明. 2016. 江南造山带新元古代中期(830~750 Ma)岩浆活动及对构造演化的制约[J]. 大地构造与成矿学, 40(4): 753-771. |
高林志, 戴传固, 刘燕学, 王敏, 王雪华, 陈建书, 丁孝忠. 2010. 黔东地区下江群凝灰岩锆石SHRIMP U-Pb年龄及其地层意义[J]. 中国地质, 37(4): 1071-1082. |
贵州省地质调查院. 2017. 中国区域地质志·贵州志[M]. 北京: 地质出版社, 1-127. |
李献华, 周汉文, 李正祥, 刘颖, Kinny P. 2001. 扬子块体西缘新元古代双峰式火山岩的锆石U-Pb年龄和岩石化学特征[J]. 地球化学, 30(4): 315-322. |
吕留彦, 李静, 曾文涛, 俞赛赢, 孙载波, 王晓峰. 2019. 滇西南南澜沧江构造岩浆岩带早侏罗世火山岩的发现——兼论云南省境内印支构造旋回的上限[J]. 中国地质, 46(6): 1270-1283. |
覃永军, 杜远生, 牟军, 卢定彪, 龙建喜, 王安华, 张厚松, 曾昌兴. 2015. 黔东南地区新元古代下江群的地层年代及其地质意义[J]. 地球科学-中国地质大学学报, 40(7): 1107-1120. |
沈洪娟, 顾尚义, 赵思凡, 吴忠银, 冯永. 2020. 华南南华纪南沱冰期海洋环境的沉积地球化学记录——来自黔东部南华系南沱组白云岩碳氧同位素和微量元素的证据[J]. 地质论评, 66(1): 214-228. |
汪正江, 王剑, 段太忠, 谢渊, 卓皆文, 杨平. 2010. 扬子克拉通内新元古代中期酸性火山岩的年代学及其地质意义[J]. 中国科学, 40(11): 1543-1551. |
魏亚楠, 江新胜, 崔晓庄, 卓皆文, 江卓斐, 蔡娟娟. 2015. 黔东南新元古代清水江组碎屑锆石U-Pb年代学研究及其地质意义[J]. 矿物岩石, 35(3): 61-71. |
吴元保, 郑永飞. 2004. 锆石成因矿物学研究及其对U-Pb年龄解释的制约[J]. 科学通报, 16: 179-185. |
尹崇玉, 高林志. 2013. 中国南华系的范畴、时限及地层划分[J]. 地层学杂志, 37(4): 534-541. |
尹崇玉, 柳永清, 高林志. 2007. 震旦(伊迪卡拉)纪早期磷酸盐化生物群——瓮安生物群特征及其环境演化[M]. 北京: 地质出版社, 1-126. |
张启锐. 2014. 关于南华系底界年龄780Ma数值的讨论[J]. 地层学杂志, 38(3): 336-339. |
张予杰, 安显银, 刘石磊, 高永娟, 郑杰, 桑永恒. 2020. 黔东北地区大塘坡组早期含锰沉积充填、岩相古地理与锰矿的关系[J]. 中国地质, 47(3): 607-626. |
郑永飞, 张少兵. 2007. 华南前寒武纪大陆地壳的形成和演化[J]. 科学通报, 52(1): 1-10. |
周传明. 2016. 扬子区新元古代前震旦纪地层对比[J]. 地层学杂志, 40(2): 120-134. |
Profile | Vegetation type | Longitude | Latitude | Elevation/m | Core depth/m | Numbers of samples | Water table depth/m |
TP1 | Grass | E88°05’18” | N44°15’56” | 498 | 5.8 | 29 | 5.9 |
TP2 | / | E88°04’39” | N44°21’5” | 472 | 8.8 | 44 | >9.0 |
TP3 | Melon | E88°05’44” | N44°12’58” | 508 | 6.4 | 32 | 6.5 |
TP4 | Sunflower | E87°57’39” | N44°11’58” | 511 | 5.7 | 29 | 5.8 |
Note: Data from the laboratory of Xi'an Center of China Geological Survey. |
δ18O | δD | ||||||||||||||
Depth/m | TP1 | Depth/m | TP2 | Depth/m | TP3 | Depth/m | TP4 | Depth/m | TP1 | Depth/m | TP2 | Depth/m | TP3 | Depth/m | TP4 |
0.2 | 3.18 | 0.2 | –2.54 | 0.2 | –9.88 | 0.1 | –7.52 | 0.2 | –37.83 | 0.2 | –68.34 | 0.2 | –90.08 | 0.1 | –71.77 |
0.4 | –1.66 | 0.4 | –1.77 | 0.4 | –3.26 | 0.3 | –11.14 | 0.4 | –68.04 | 0.4 | –72.03 | 0.4 | –46.50 | 0.3 | –87.97 |
0.6 | –4.53 | 0.6 | –8.19 | 0.6 | –7.79 | 0.5 | –12.70 | 0.6 | –78.37 | 0.6 | –96.50 | 0.6 | –75.06 | 0.5 | –98.64 |
0.8 | –6.36 | 0.8 | –6.29 | 0.8 | –10.16 | 0.7 | –14.92 | 0.8 | –79.58 | 0.8 | –87.22 | 0.8 | –88.11 | 0.7 | –98.03 |
1 | –6.73 | 1 | –11.59 | 1 | –10.51 | 0.9 | –14.91 | 1.0 | –76.34 | 1.0 | –108.31 | 1.0 | –94.37 | 0.9 | –97.57 |
1.2 | –8.13 | 1.2 | –9.67 | 1.2 | –12.85 | 1.1 | –11.86 | 1.2 | –78.61 | 1.2 | –105.06 | 1.2 | –99.55 | 1.1 | –91.68 |
1.4 | –7.49 | 1.4 | –5.67 | 1.4 | –12.79 | 1.3 | –13.79 | 1.4 | –78.51 | 1.4 | –82.79 | 1.4 | –96.10 | 1.3 | –105.33 |
1.6 | –9.10 | 1.6 | –9.86 | 1.6 | –13.41 | 1.5 | –15.19 | 1.6 | –85.65 | 1.6 | –95.47 | 1.6 | –99.96 | 1.5 | –112.93 |
1.8 | –11.01 | 1.8 | –9.53 | 1.8 | –13.06 | 1.7 | –16.61 | 1.8 | –91.34 | 1.8 | –103.69 | 1.8 | –103.33 | 1.7 | –108.86 |
2 | –10.59 | 2 | –11.89 | 2 | –12.90 | 1.9 | –11.25 | 2.0 | –92.24 | 2.0 | –115.57 | 2.0 | –99.59 | 1.9 | –91.89 |
2.2 | –10.79 | 2.2 | –13.07 | 2.2 | –10.64 | 2.1 | –9.56 | 2.2 | –88.59 | 2.2 | –124.10 | 2.2 | –85.76 | 2.1 | –77.21 |
2.4 | –11.42 | 2.4 | –10.03 | 2.4 | –10.65 | 2.3 | –15.54 | 2.4 | –94.96 | 2.4 | –104.59 | 2.4 | –81.60 | 2.3 | –100.39 |
2.6 | –13.44 | 2.6 | –12.53 | 2.6 | –11.47 | 2.5 | –14.23 | 2.6 | –105.78 | 2.6 | –114.06 | 2.6 | –89.40 | 2.5 | –107.72 |
2.8 | –12.24 | 2.8 | –8.16 | 2.8 | –12.81 | 2.7 | –13.78 | 2.8 | –97.37 | 2.8 | –89.83 | 2.8 | –94.49 | 2.7 | –104.02 |
3 | –11.88 | 3 | –9.41 | 3 | –12.96 | 2.9 | –11.07 | 3.0 | –89.79 | 3.0 | –96.45 | 3.0 | –96.59 | 2.9 | –83.68 |
3.2 | –11.67 | 3.2 | –9.33 | 3.2 | –13.94 | 3.1 | –13.88 | 3.2 | –87.26 | 3.2 | –94.99 | 3.2 | –102.61 | 3.1 | –89.91 |
3.4 | –14.69 | 3.4 | –8.22 | 3.4 | –14.00 | 3.3 | –14.00 | 3.4 | –104.18 | 3.4 | –96.18 | 3.4 | –94.11 | 3.3 | –102.57 |
3.6 | –15.25 | 3.6 | –8.76 | 3.6 | –13.29 | 3.5 | –13.96 | 3.6 | –107.56 | 3.6 | –92.32 | 3.6 | –102.58 | 3.5 | –110.47 |
3.8 | –14.10 | 3.8 | –9.03 | 3.8 | –12.99 | 3.7 | –12.50 | 3.8 | –104.31 | 3.8 | –88.75 | 3.8 | –101.63 | 3.7 | –96.10 |
4 | –11.28 | 4 | –10.68 | 4 | –12.62 | 3.9 | –11.41 | 4.0 | –87.24 | 4.0 | –104.77 | 4.0 | –95.04 | 3.9 | –89.89 |
4.2 | –12.32 | 4.2 | –9.03 | 4.2 | –12.20 | 4.1 | –13.89 | 4.2 | –92.19 | 4.2 | –102.19 | 4.2 | –88.46 | 4.1 | –84.39 |
4.4 | –12.86 | 4.4 | –9.32 | 4.4 | –14.73 | 4.3 | –13.91 | 4.4 | –94.96 | 4.4 | –92.00 | 4.4 | –108.40 | 4.3 | –108.65 |
4.6 | –13.63 | 4.6 | –10.50 | 4.6 | –13.52 | 4.5 | –14.35 | 4.6 | –99.77 | 4.6 | –95.40 | 4.6 | –103.84 | 4.5 | –106.96 |
4.8 | –12.83 | 4.8 | –10.15 | 4.8 | –13.08 | 4.7 | –14.46 | 4.8 | –95.96 | 4.8 | –93.75 | 4.8 | –102.48 | 4.7 | –106.05 |
5 | –12.34 | 5 | –9.77 | 5 | –11.95 | 4.9 | –10.46 | 5.0 | –94.69 | 5.0 | –96.09 | 5.0 | –92.47 | 4.9 | –80.20 |
5.2 | –12.16 | 5.2 | –10.44 | 5.2 | –11.61 | 5.1 | –13.61 | 5.2 | –88.65 | 5.2 | –97.39 | 5.2 | –82.63 | 5.1 | –84.93 |
5.4 | –13.55 | 5.4 | –10.86 | 5.4 | –13.90 | 5.3 | –13.90 | 5.4 | –97.44 | 5.4 | –95.88 | 5.4 | –107.26 | 5.3 | –103.76 |
5.6 | –14.97 | 5.6 | –9.91 | 5.6 | –14.01 | 5.5 | –17.38 | 5.6 | –105.54 | 5.6 | –94.42 | 5.6 | –102.68 | 5.5 | –110.91 |
5.8 | –14.42 | 5.8 | –11.01 | 5.8 | –13.36 | 5.7 | –12.91 | 5.8 | –102.95 | 5.8 | –95.10 | 5.8 | –91.56 | 5.7 | –92.57 |
6 | –12.04 | 6 | –13.75 | 6.0 | –102.84 | 6.0 | –92.35 | ||||||||
6.2 | –11.15 | 6.2 | –10.81 | 6.2 | –101.43 | 6.2 | –86.39 | ||||||||
6.4 | –10.36 | 6.4 | –12.24 | 6.4 | –96.19 | 6.4 | –88.13 | ||||||||
6.6 | –11.04 | 6.6 | –109.10 | ||||||||||||
6.8 | –11.36 | 6.8 | –98.40 | ||||||||||||
7 | –10.11 | 7.0 | –102.30 | ||||||||||||
7.2 | –13.26 | 7.2 | –105.29 | ||||||||||||
7.4 | –12.48 | 7.4 | –96.44 | ||||||||||||
7.6 | –12.17 | 7.6 | –102.46 | ||||||||||||
7.8 | –14.19 | 7.8 | –110.15 | ||||||||||||
8 | –10.99 | 8.0 | –102.28 | ||||||||||||
8.2 | –13.94 | 8.2 | –108.93 | ||||||||||||
8.4 | –15.23 | 8.4 | –109.79 | ||||||||||||
8.6 | –12.01 | 8.6 | –96.24 | ||||||||||||
8.8 | –11.46 | 8.8 | –91.14 |
TP1 | TP2 | TP3 | TP4 | ||||
δ18O | δD | δ18O | δD | δ18O | δD | δ18O | δD |
3.18 | –37.83 | –2.54 | –68.34 | –9.88 | –90.08 | –7.52 | –71.77 |
–1.66 | –68.04 | –1.77 | –72.03 | –3.26 | –46.50 | –11.14 | –87.97 |
–4.53 | –78.37 | –8.19 | –96.50 | –7.79 | –75.06 | –12.70 | –98.64 |
–6.36 | –79.58 | –6.29 | –87.22 | –10.16 | –88.11 | –14.92 | –98.03 |
–6.73 | –76.34 | –11.59 | –108.31 | –10.51 | –94.37 | –14.91 | –97.57 |
–8.13 | –78.61 | –9.67 | –105.06 | –12.85 | –99.55 | –11.86 | –91.68 |
–7.49 | –78.51 | –5.67 | –82.79 | –12.79 | –96.10 | –13.79 | –105.33 |
–9.10 | –85.65 | –9.86 | –95.47 | –13.41 | –99.96 | –15.19 | –112.93 |
–11.01 | –91.34 | –9.53 | –103.69 | –13.06 | –103.33 | –16.61 | –108.86 |
–10.59 | –92.24 | –11.89 | –115.57 | –12.90 | –99.59 | –11.25 | –91.89 |
–10.79 | –88.59 | –13.07 | –124.10 | –10.64 | –85.76 | –9.56 | –77.21 |
–11.42 | –94.96 | –10.03 | –104.59 | –10.65 | –81.60 | –15.54 | –100.39 |
–13.44 | –105.78 | –12.53 | –114.06 | –11.47 | –89.40 | –14.23 | –107.72 |
–12.24 | –97.37 | –8.16 | –89.83 | –12.81 | –94.49 | –13.78 | –104.02 |
–11.88 | –89.79 | –9.41 | –96.45 | –12.96 | –96.59 | –11.07 | –83.68 |
–11.67 | –87.26 | –9.33 | –94.99 | –13.94 | –102.61 | –13.88 | –89.91 |
–14.69 | –104.18 | –8.22 | –96.18 | –14.00 | –94.11 | –14.00 | –102.57 |
–15.25 | –107.56 | –8.76 | –92.32 | –13.29 | –102.58 | –13.96 | –110.47 |
–14.10 | –104.31 | –9.03 | –88.75 | –12.99 | –101.63 | –12.50 | –96.10 |
–11.28 | –87.24 | –10.68 | –104.77 | –12.62 | –95.04 | –11.41 | –89.89 |
–12.32 | –92.19 | –9.03 | –102.19 | –12.20 | –88.46 | –13.89 | –84.39 |
–12.86 | –94.96 | –9.32 | –92.00 | –14.73 | –108.40 | –13.91 | –108.65 |
–13.63 | –99.77 | –10.50 | –95.40 | –13.52 | –103.84 | –14.35 | –106.96 |
–12.83 | –95.96 | –10.15 | –93.75 | –13.08 | –102.48 | –14.46 | –106.05 |
–12.34 | –94.69 | –9.77 | –96.09 | –11.95 | –92.47 | –10.46 | –80.20 |
–12.16 | –88.65 | –10.44 | –97.39 | –11.61 | –82.63 | –13.61 | –84.93 |
–13.55 | –97.44 | –10.86 | –95.88 | –13.90 | –107.26 | –13.90 | –103.76 |
–14.97 | –105.54 | –9.91 | –94.42 | –14.01 | –102.68 | –17.38 | –110.91 |
–14.42 | –102.95 | –11.01 | –95.10 | –13.36 | –91.56 | –12.91 | –92.57 |
–12.04 | –102.84 | –13.75 | –92.35 | ||||
–11.15 | –101.43 | –10.81 | –86.39 | ||||
–10.36 | –96.19 | –12.24 | –88.13 | ||||
–11.04 | –109.10 | ||||||
–11.36 | –98.40 | ||||||
–10.11 | –102.30 | ||||||
–13.26 | –105.29 | ||||||
–12.48 | –96.44 | ||||||
–12.17 | –102.46 | ||||||
–14.19 | –110.15 | ||||||
–10.99 | –102.28 | ||||||
–13.94 | –108.93 | ||||||
–15.23 | –109.79 | ||||||
–12.01 | –96.24 | ||||||
–11.46 | –91.14 |
Profile | Moisture content/(cm3/cm3) | Cl- concentration/(mg/ L) | Total Cl- storage/(g/m2) | SO42- concentration/(mg/L) | Total SO42- storage/(g/m2) | ||||||
Mean | Min | Max | Mean | Min | Max | Mean | Min | Max | |||
TP1 | 18.7 | 9.4 | 29.7 | 9169.3 | 4279.2 | 24354.5 | 9861.2 | 46907.6 | 11004.1 | 175435.4 | 29533.9 |
TP2 | 7.7 | 1.8 | 17.0 | 33904.7 | 14548.5 | 64989.1 | 28762.7 | 41372.3 | 3417.0 | 214988.2 | 30696.7 |
TP3 | 17.9 | 5.8 | 33.7 | 300.9 | 74.1 | 1044.8 | 326.2 | 1297.5 | 234.2 | 6162.9 | 741.0 |
TP4 | 22.4 | 9.2 | 35.0 | 457.4 | 98.0 | 1079.0 | 822.5 | 2569.5 | 1187.1 | 6809.3 | 4072.6 |
Tectonic location of Guizhou Province (a) and sampling and section location map in Kaiyang area(b)
CL images of the detrital zircon of Qingshuijiang Formation in Kaiyang area
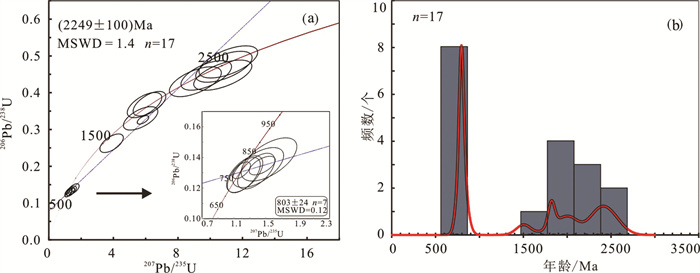
Zircon U-Pb concordia diagram (a) and histogram (b) of the detrital zircons of the Qingshuijiang Formation in Kaiyang area
Curve of volcanic debris content and photomicrographs of the Qingshuijiang Formation in Kaiyang area
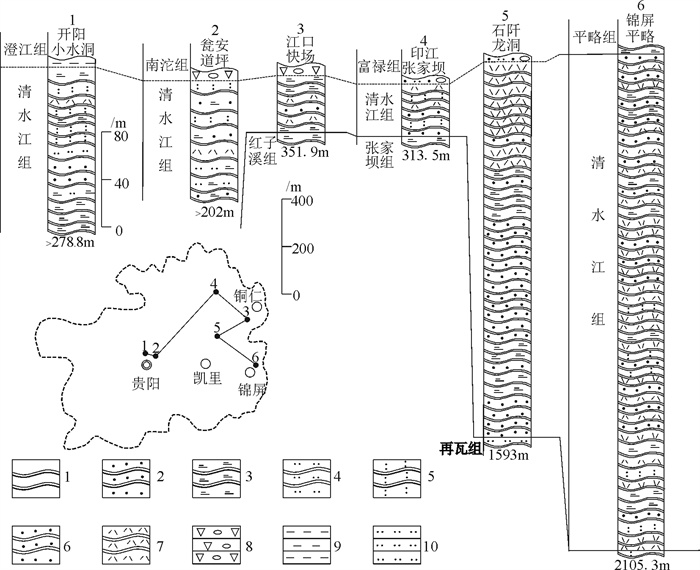
Columnar comparison chart of typical section in the Qingshuijiang Formation
Lithofacies palaeogeographic map of the Chengjiang Formation in Kaiyang area